> ## Documentation Index
> Fetch the complete documentation index at: https://docs.explo.co/llms.txt
> Use this file to discover all available pages before exploring further.
# Bar Charts
> Here's how to enable drilldowns for bar charts
### Enable Drilldowns
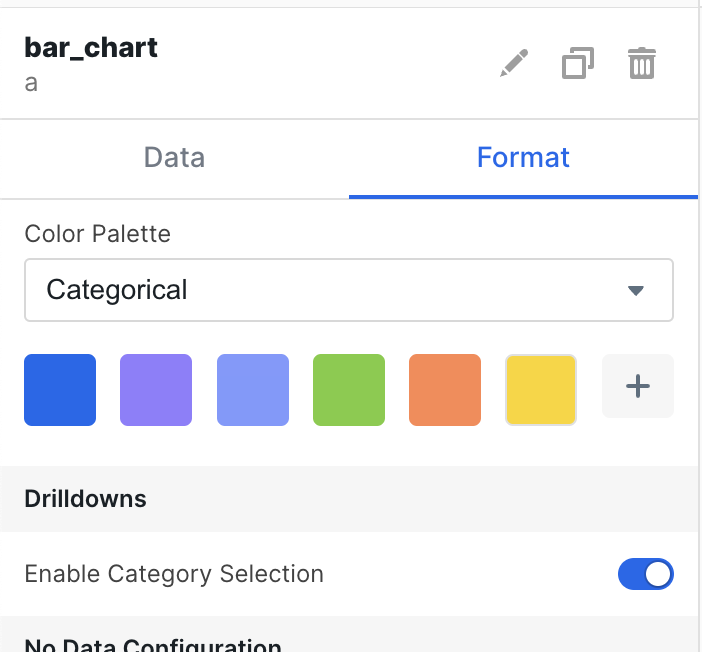
The first step to setting up the drilldown is to enable it in the bar chart
itself. In the config you can enable category selection in the drilldown menu.
Select the option to turn on the drilldown.
 ### Variables
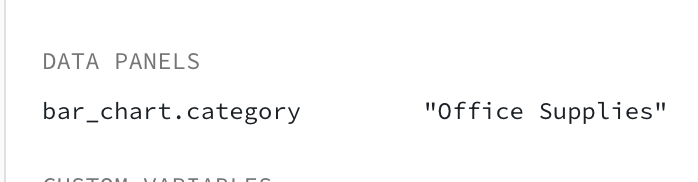
When drilldown is turned on for that bar chart, a variable will be created for
that chart. The underlying value will be assigned to a variable with the format
`chart_id.category` as shown below.
You can then use the new variable as you would any other variable generated from
a filter or dropdown in the SQL editor or in the filter config for individual
charts.
For more information on how to use variables, you can reference the docs
[here](/creating-dashboards/variables/using-variables).
### Variables
When drilldown is turned on for that bar chart, a variable will be created for
that chart. The underlying value will be assigned to a variable with the format
`chart_id.category` as shown below.
You can then use the new variable as you would any other variable generated from
a filter or dropdown in the SQL editor or in the filter config for individual
charts.
For more information on how to use variables, you can reference the docs
[here](/creating-dashboards/variables/using-variables).
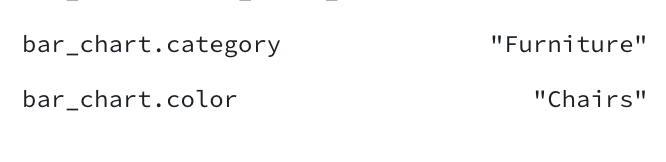
 If the bar chart is grouped then two variables will be set once a value is
selected like below.
If the bar chart is grouped then two variables will be set once a value is
selected like below.