> ## Documentation Index
> Fetch the complete documentation index at: https://docs.explo.co/llms.txt
> Use this file to discover all available pages before exploring further.
# Underlying Data Drilldowns
Easily expose the data powering different visualizations on your dashboard.
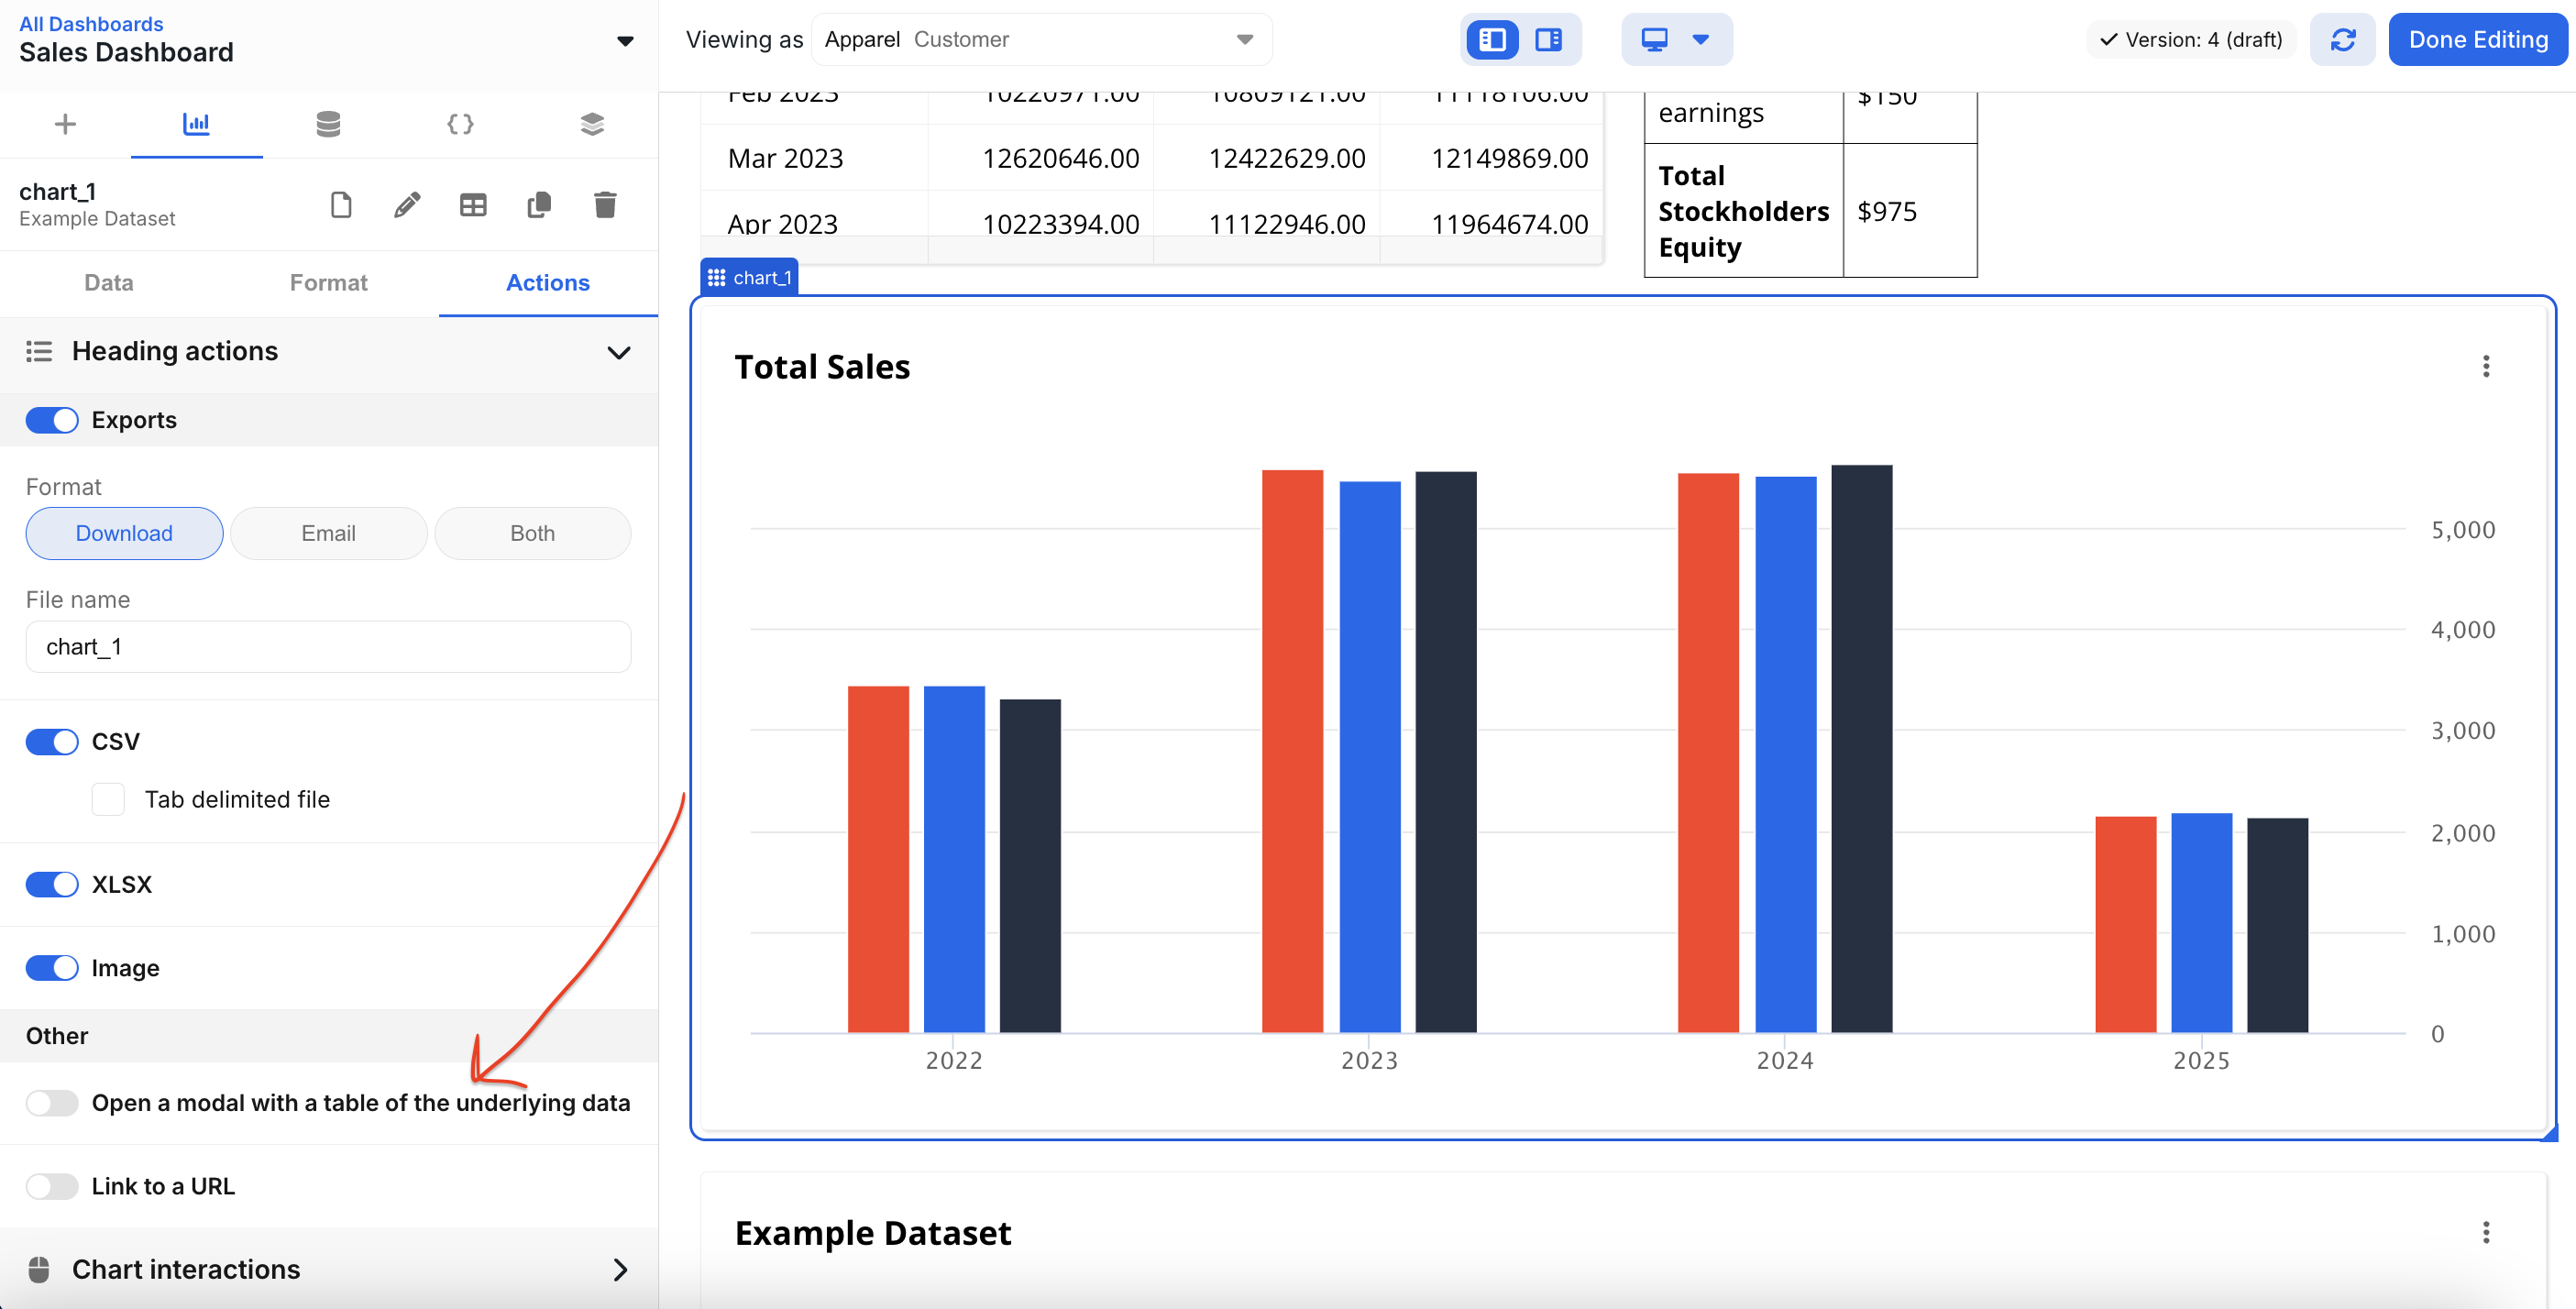
 Turn on underlying data drilldowns, go to the `actions` tab and enable the option “**Open a modal with a table of the underlying data**”.
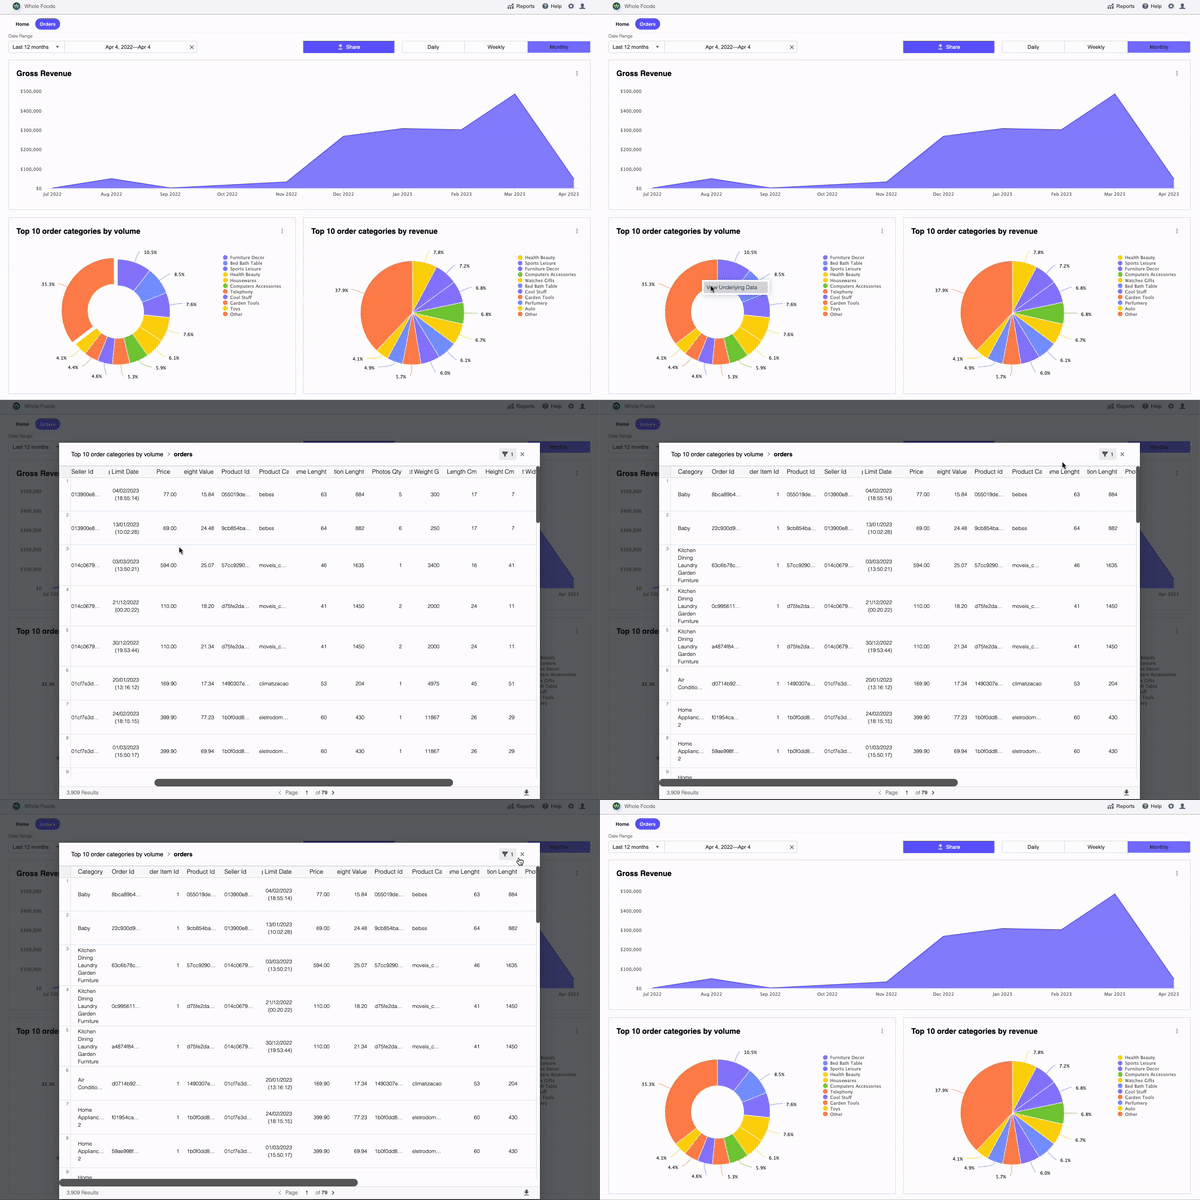
 To open the drilldown modal, users can do one of the following:
1. Select the option in the triple dot menu on the top right of each component.
2. Click on a data point (bar, slice, point, etc.). This will create a table view of only data for that specific slice of the data.
Once the modal has been opened the underlying data table can be treated as
standard data tables. All filtering and exporting options are available on the
drilldown tables.
To open the drilldown modal, users can do one of the following:
1. Select the option in the triple dot menu on the top right of each component.
2. Click on a data point (bar, slice, point, etc.). This will create a table view of only data for that specific slice of the data.
Once the modal has been opened the underlying data table can be treated as
standard data tables. All filtering and exporting options are available on the
drilldown tables.