> ## Documentation Index
> Fetch the complete documentation index at: https://docs.explo.co/llms.txt
> Use this file to discover all available pages before exploring further.
# Overview
> Explo offers a number of UI Elements you can add onto your dashboards.
These elements are defined in 3 categories: Controls, Export, and Display.
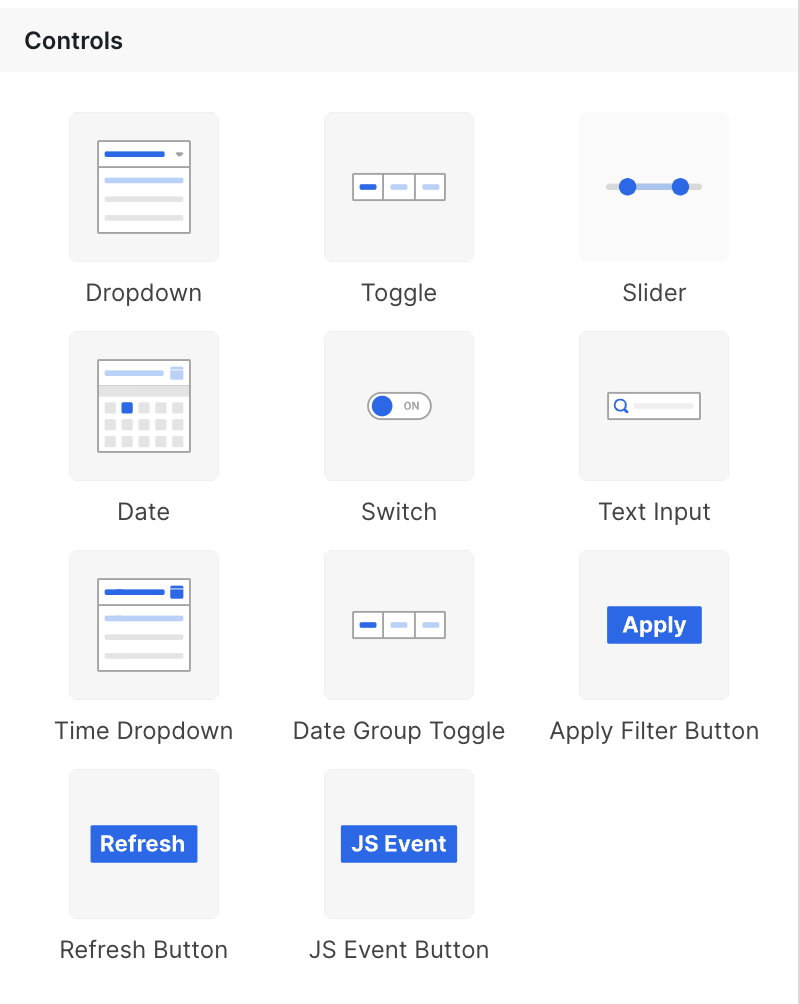
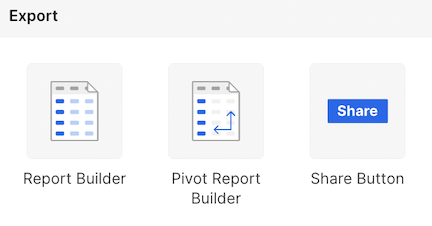
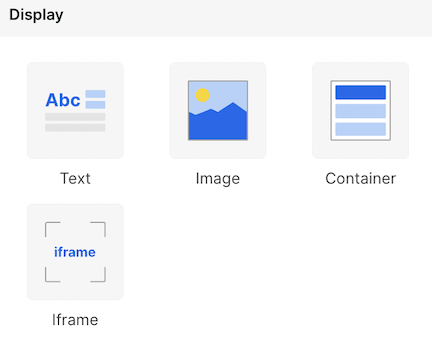 * Drag and drop these UI Elements onto your dashboard to use them.
* To edit a UI element, **double-click on the component** and the editor will
appear in the left side panel.
## Adding a new UI Element
* Drag and drop these UI Elements onto your dashboard to use them.
* To edit a UI element, **double-click on the component** and the editor will
appear in the left side panel.
## Adding a new UI Element
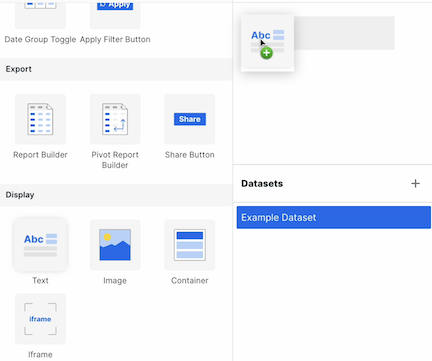 Adding new components is easy! Simply drag the component onto the canvas to get
started. You will see a hovering shadow, indicating where the component will go
when you drop it.
## Filtering
You can now filter charts directly from the UI elements.
Scroll down to the bottom of the `Setup` page to see the configuration options. With the setup process, you will setup the following relationship:
Adding new components is easy! Simply drag the component onto the canvas to get
started. You will see a hovering shadow, indicating where the component will go
when you drop it.
## Filtering
You can now filter charts directly from the UI elements.
Scroll down to the bottom of the `Setup` page to see the configuration options. With the setup process, you will setup the following relationship:
`Selected Field` `Operator` `UI Element Value`
Some concrete examples:
`ecommerce_order_shipment_date` `is between` `date range`
`category_field` `is in` `multiselect dropdown values`
And so on...
The configuration process is below.
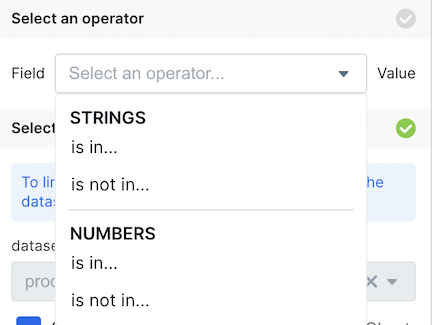
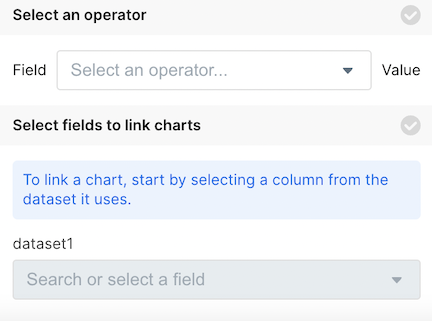 First, select your operator.
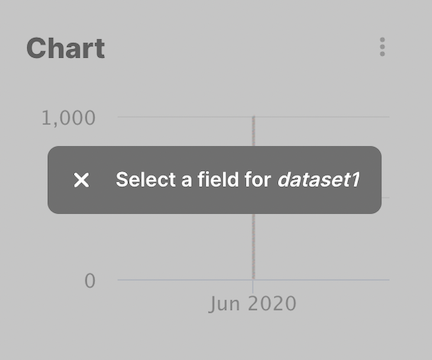
 At this point, the charts on the dashboard will tell you that you need to Select a Field that the operator applies to.
 You can now select the field and which charts you want the filter to apply to.
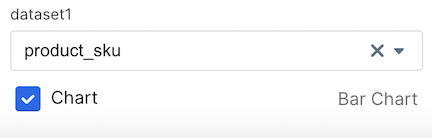 You will then get the message from the chart that the filter is configured.
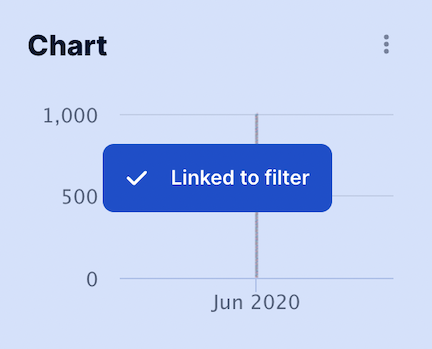 And now you have a filter configured for the charts!