> ## Documentation Index
> Fetch the complete documentation index at: https://docs.explo.co/llms.txt
> Use this file to discover all available pages before exploring further.
# Datasets
A Report Builder dataset is a table of data that your end users will be able explore and use to build reports and visualizations.
## Defining a dataset
A dataset is defined using SQL. The SQL can be as simple or complex as needed. It may be pulling an entire table from a datasource using a `select *`, or it may contain business logic including calculated columns, joins and filters.
You will also need to use the dynamic customer variables to make sure the data is filtered by the customer entity. Read more about this [here](/creating-dashboards/variables/types-of-variables/customer-object)
## Permissions
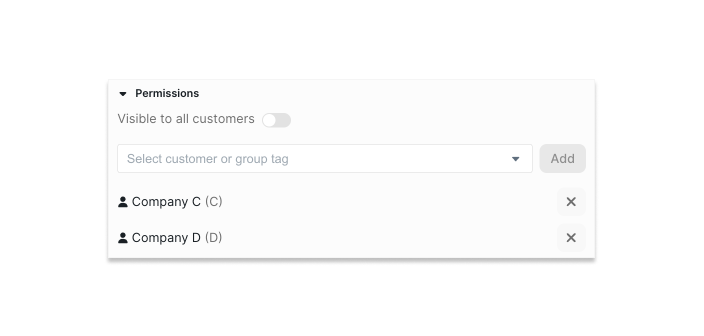
You can specify permissions on datasets to allow access to some or all of your customers. This can be specified at the customer level or the group tag level. Read more about group tags [here](/getting-started/group-tags#filtering-on-the-frontend-by-group-tag)
 ## Column Selection and Formatting
Once the dataset is defined with SQL, you can use the column selection and formatting sections to clean up and style the data.
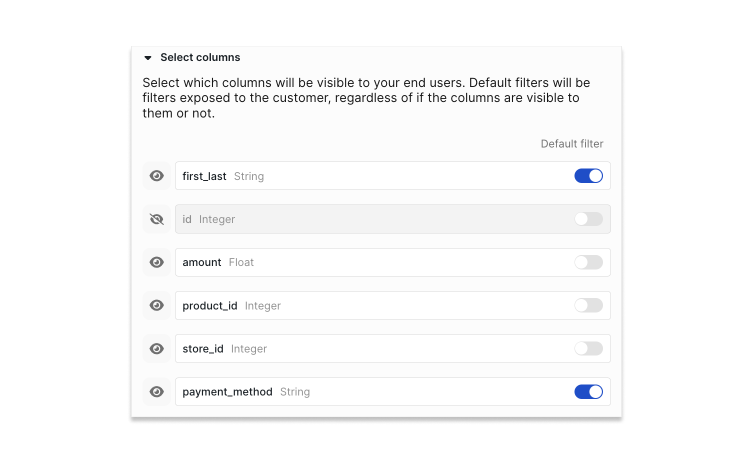
In the column selection section, you can specify column visibility and default filters. Default filters will appear initially on new reports using that dataset, but they will be empty.
## Column Selection and Formatting
Once the dataset is defined with SQL, you can use the column selection and formatting sections to clean up and style the data.
In the column selection section, you can specify column visibility and default filters. Default filters will appear initially on new reports using that dataset, but they will be empty.
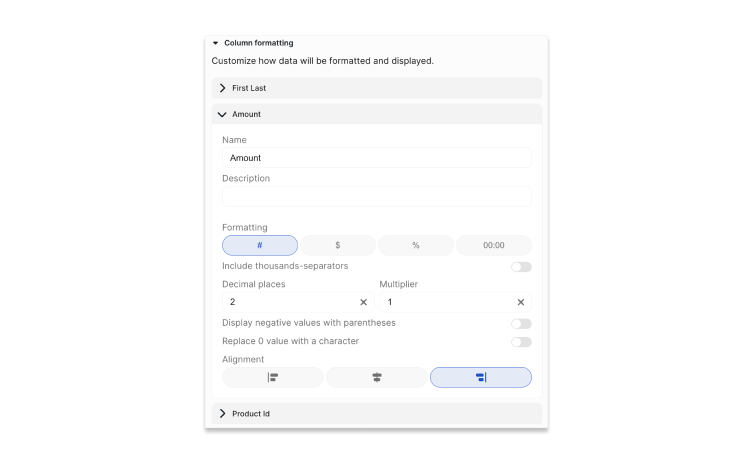
 In the column formatting section, you can rename columns, add descriptions, and format the values based on column type.
 ## Custom Aggregations
You can define formulas for aggregating data that your team and your end users can use in reports. Read more about these [here](/report-builder-features/custom-aggregations).
## Custom Aggregations
You can define formulas for aggregating data that your team and your end users can use in reports. Read more about these [here](/report-builder-features/custom-aggregations).