> ## Documentation Index
> Fetch the complete documentation index at: https://docs.explo.co/llms.txt
> Use this file to discover all available pages before exploring further.
# Custom Menu
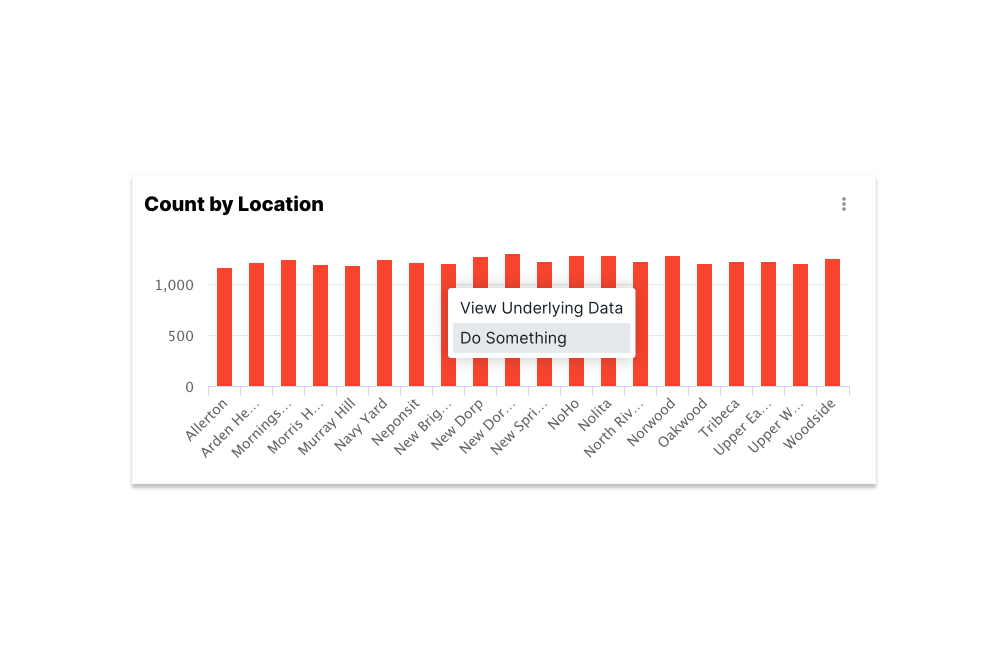
> The Custom Menu option allows you add a menu option to a chart that then fires off a javascript event when clicked on by the end user.
 ## Configuration
The configuration for this custom menu option can be found in the Action tab for the following charts:
* Bar Chart
* Line Chart
* Area Chart
* Pie Chart
* Heat Map
* Boxplot
## Configuration
The configuration for this custom menu option can be found in the Action tab for the following charts:
* Bar Chart
* Line Chart
* Area Chart
* Pie Chart
* Heat Map
* Boxplot
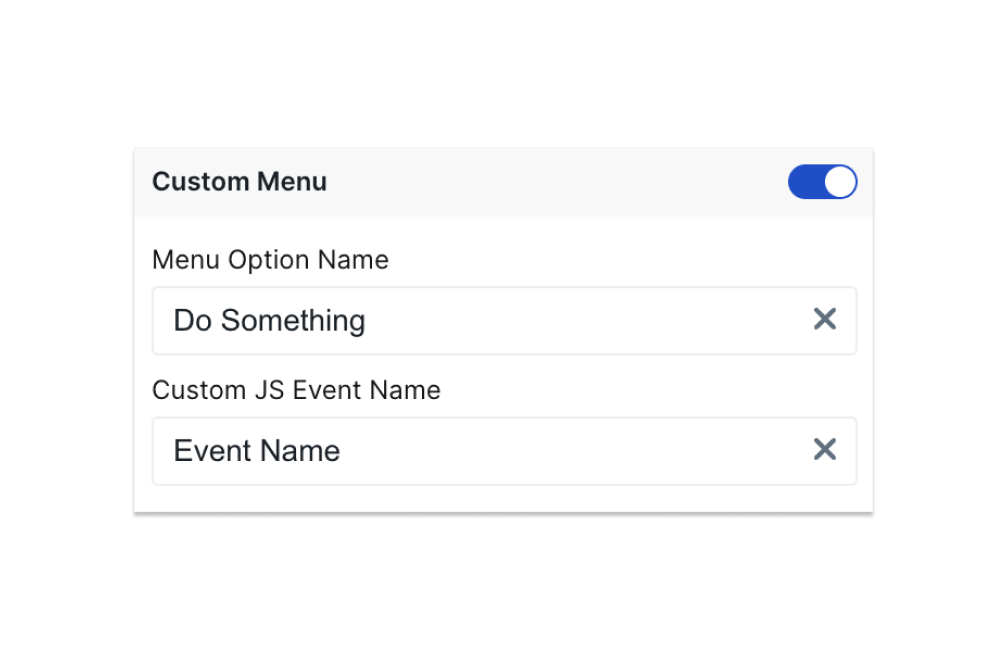 Once toggled on, you’ll need to specify the name of the menu option under Menu Option Name.
This is what will show up when a certain bar, point, slice, etc. is clicked. Then you will
specify the javascript event name under Customer JS Event Name. This will be the name that
is passed into the event listener in your frontend code that will then trigger the desired action.
The detail body that is passed with the javascript event contains the `category` value and `color` value.
Once toggled on, you’ll need to specify the name of the menu option under Menu Option Name.
This is what will show up when a certain bar, point, slice, etc. is clicked. Then you will
specify the javascript event name under Customer JS Event Name. This will be the name that
is passed into the event listener in your frontend code that will then trigger the desired action.
The detail body that is passed with the javascript event contains the `category` value and `color` value.