Documentation Index
Fetch the complete documentation index at: https://docs.explo.co/llms.txt
Use this file to discover all available pages before exploring further.
Configuring Analytics
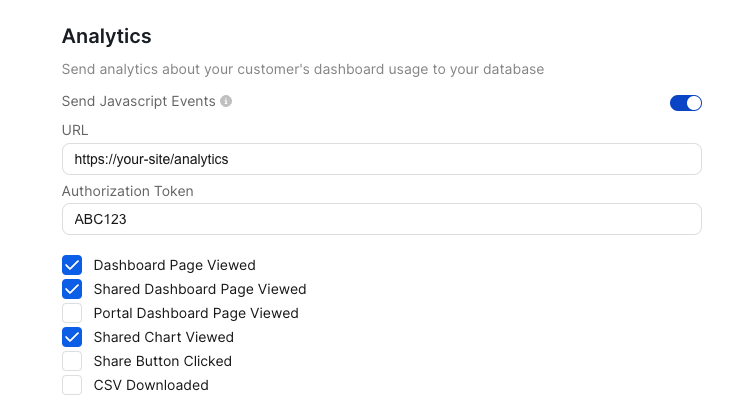
On the settings page, there’s a subsection in the Developers section for
Analytics. From here, you can supply a URL and, optionally, authorization token
for Explo to send information to and select the set of actions you want
reported.
Note that the url must be formatted as a valid url with http:// or https://.
If you’d like to receive a Javascript Event when an Analytics Event is sent, set up an event listener for analyticsEventFired. Read about javascript events.

Analytics Data
When, for example, your dashboard is viewed from a Share link, Explo will send a
request to the supplied URL with the following shape.
| Field | Type | Description |
|---|
| user_id | string | Id of the user who triggered the event |
| name | string | The type of event triggered |
| properties | json | Metadata about the event |
| custom_properties | json | Custom metadata passed in to embedded web component |
Event Types
Shared Event Types
| Name |
|---|
| Portal Dashboard Page Viewed |
| Data Panel PDF Downloaded |
| CSV Downloaded |
| Table Sorted |
| Table Paged |
| Table Filtered |
| Dropdown Selected |
| Multiselect Selected |
| Datepicker Selected |
Explore Specific Event Types
| Name |
|---|
| Dashboard Page Viewed |
| Shared Dashboard Page Viewed |
| Shared Chart Viewed |
| Share Button Clicked |
Shared Properties
| Field | Type |
|---|
| team_id | int |
| team_name | string |
| customer_id | int |
| customer_name | string |
| customer_provided_id | string |
| customer_is_demo | boolean |
Explore Properties
| Field | Type |
|---|
| dashboard_template_id | int |
| dashboard_template_name | string |
Page View Event Additional Properties
| Field | Type | Description |
|---|
| is_production | bool | true if this is a production dashboard |
| environment | string | the environment tag supplied when the dashboard was embedded |
| is_strict | bool | whether the dashboard was embedded in strict mode |
| embed_source | string | share or iframe, depending on how the dashboard was embedded |
Recommended Ways to Test
Internally, we use Beeceptor to test these endpoints. It ensures the requests are sending and that the request body is structured as expected. All you need to do is launch a mock server and use that generated endpoint, like garytesting.free.beeceptor.com, in the URL field in the Explo app.
Then, open your embedded dashboard and fire some events to see it flow to Beeceptor.