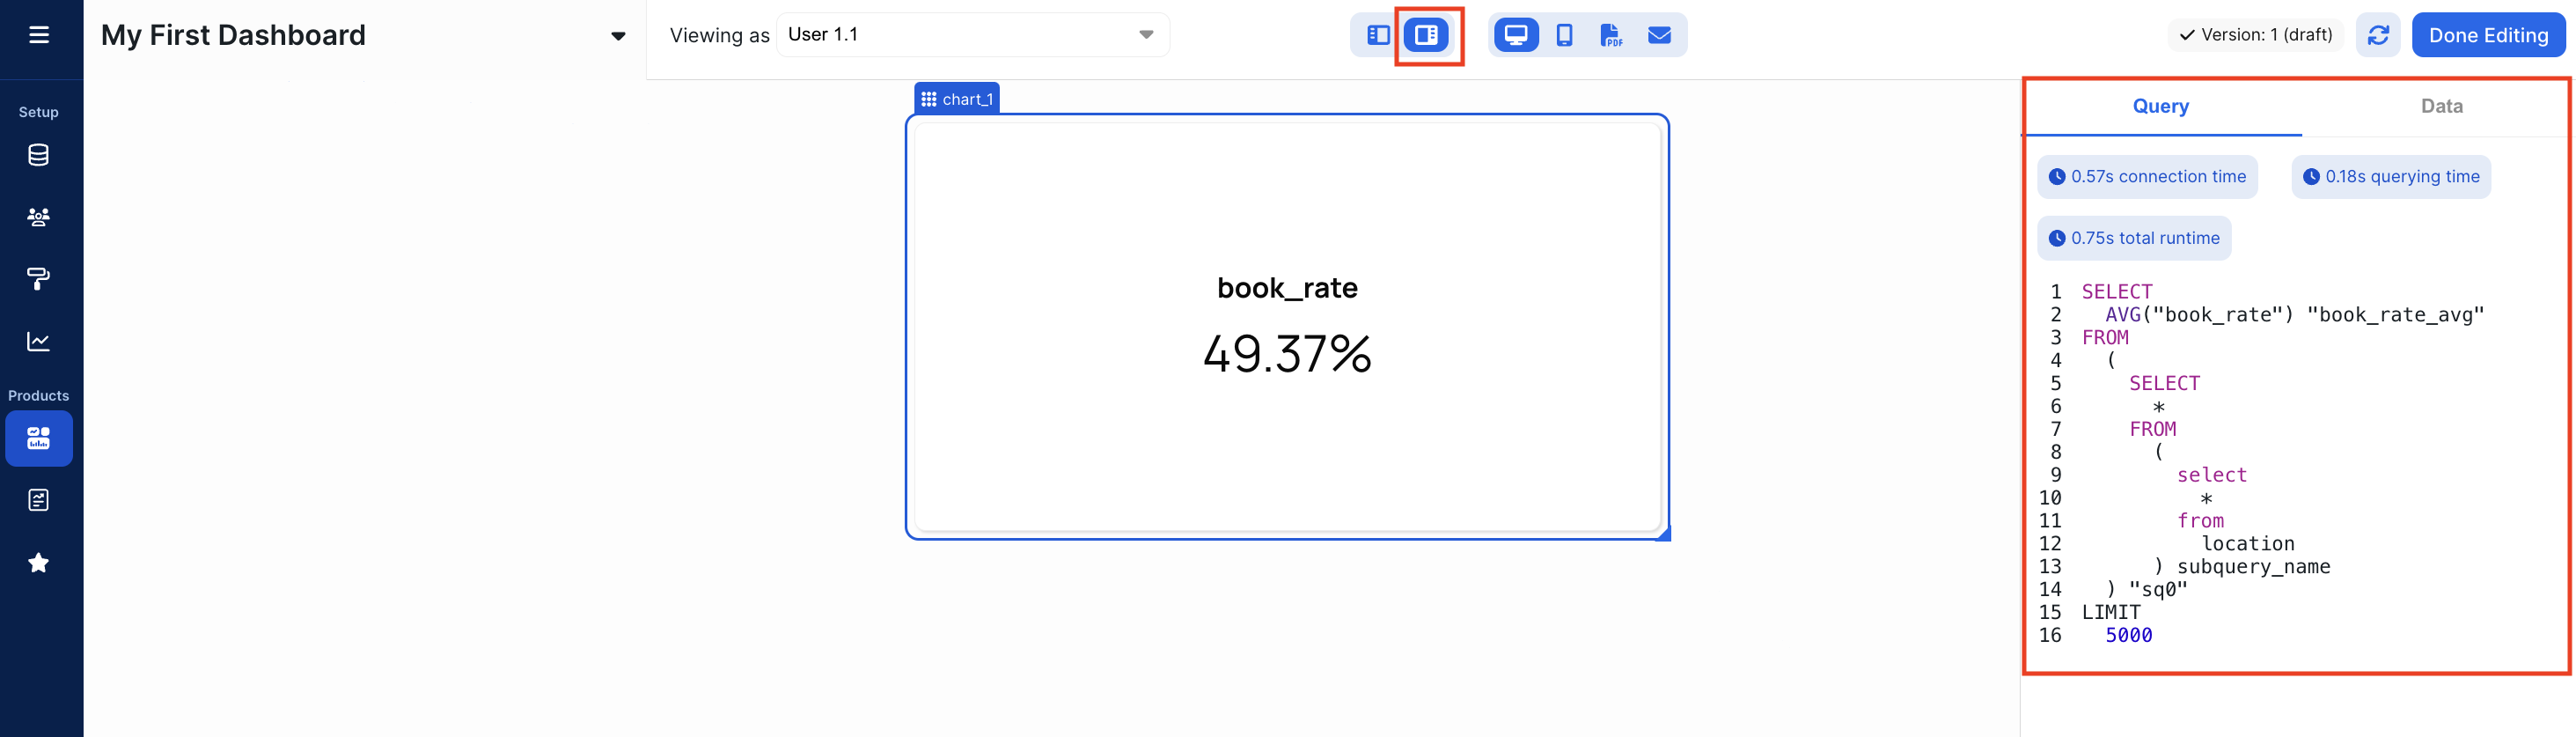
Query
- Connection time: time it took to connect to your database, before the query itself is run
- If this is too much time, you should consider performance improvements like increasing the number of available connections to your database. Reach out to Explo support for suggestions and help.
- Querying time: time it took to run the query in your database
- If this is too much time, you should consider looking at your datasets in Explo to see if they can be optimized. If AI is enabled for your account, you can also use it for help with query optimization.
- Processing time: time it took for Explo to read the results of the query
- Total runtime: total runtime it took to run and return the query
cache missorcache hit: If cache is missed, the query will run in your database and the metrics above will be returned. If cache is hit, the metrics above are not shown as the resulting data is pulled directly from the cache.
The same debugger view is available on the dataset editor’s query tab in the “Executed Query” section. This view will show you the query that was run with variables inserted and the same statistics as above.