Dataset Management
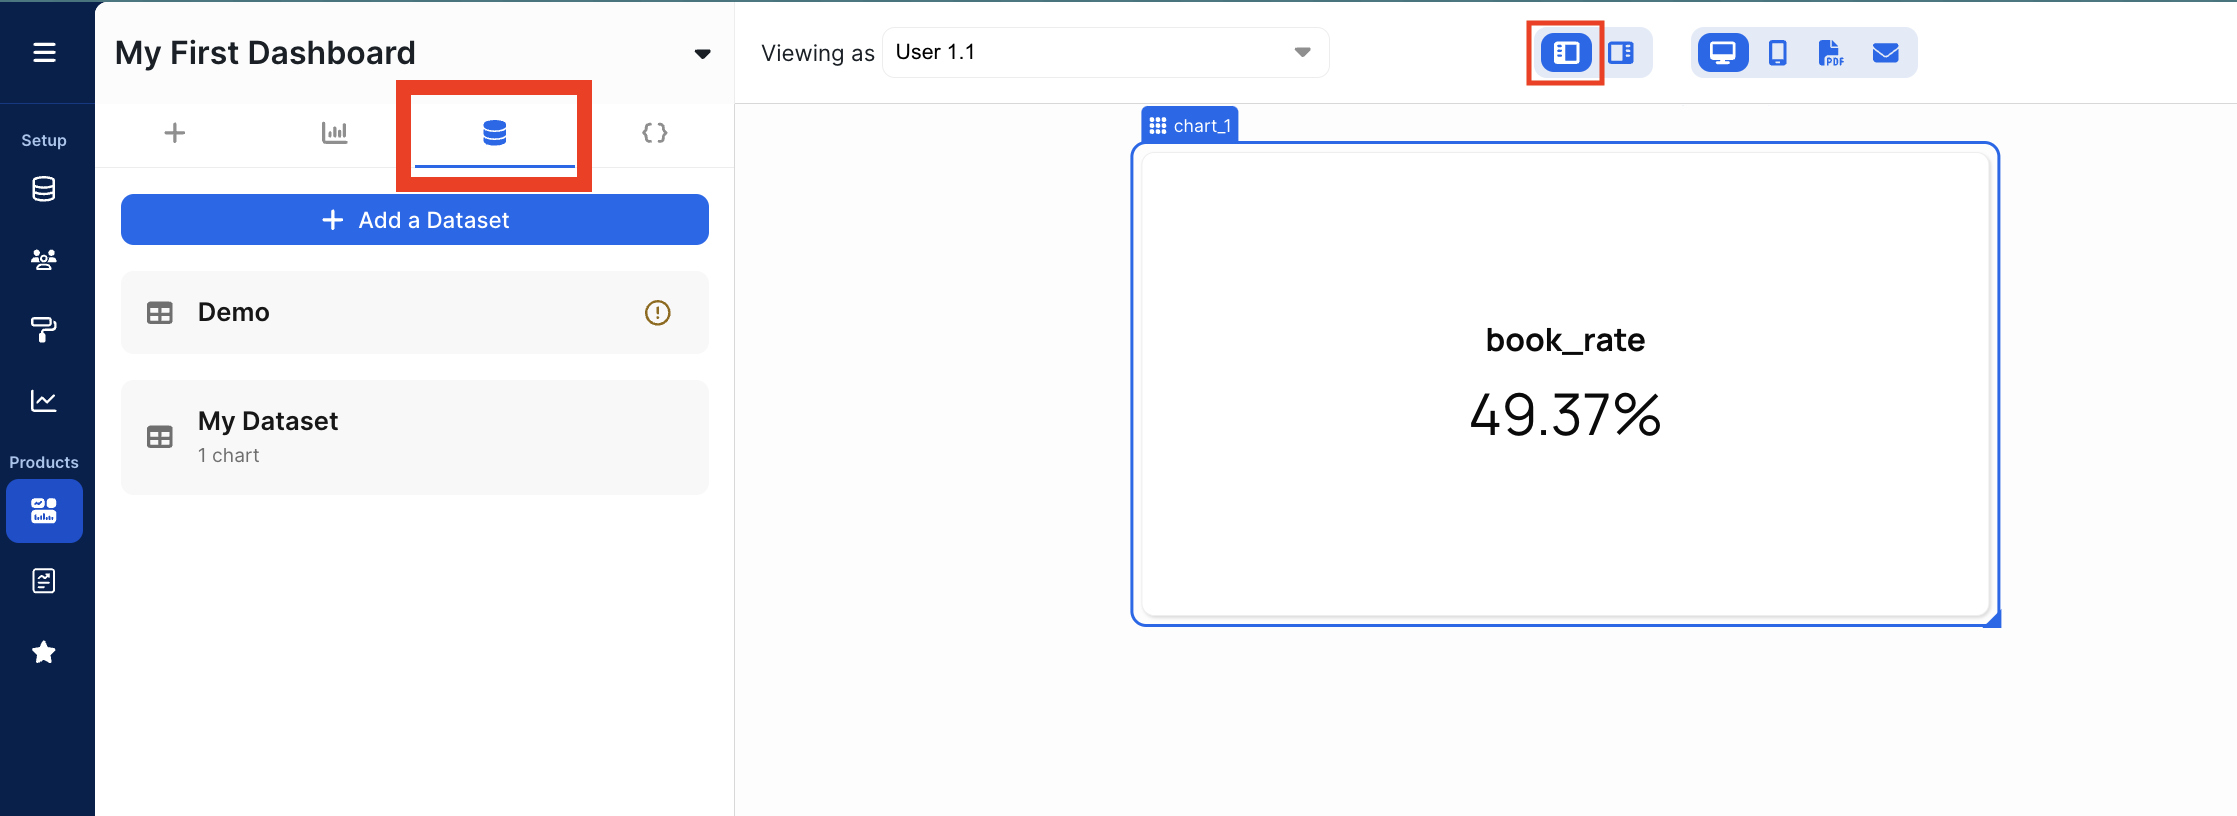
You can perform the following actions from the datasets panel: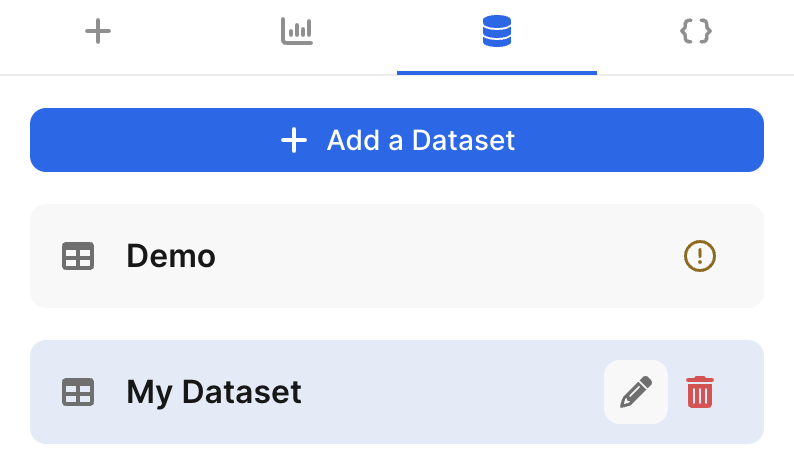
- Add a dataset (and select its schema)
- Edit a dataset’s name
- Delete a dataset
- A dataset can only be deleted if it is not tied to any charts or filters
- Select a dataset to open up the editor
Dataset Editor
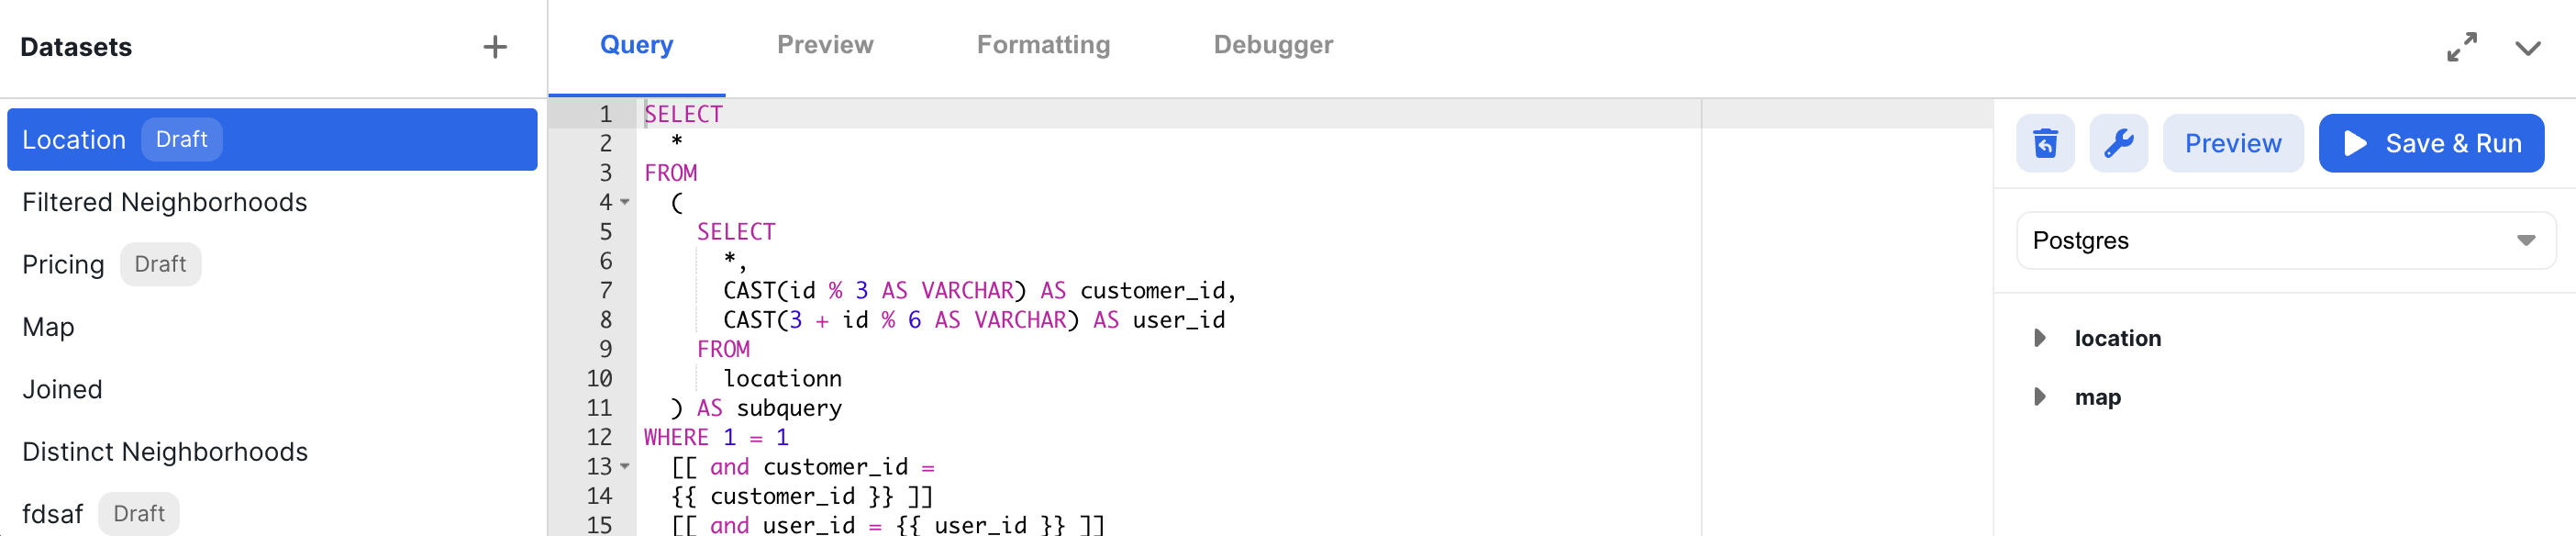
Once a dataset has been selected, you can use the editor to create, edit, execute, and save a query. You can also format the data generated.Query
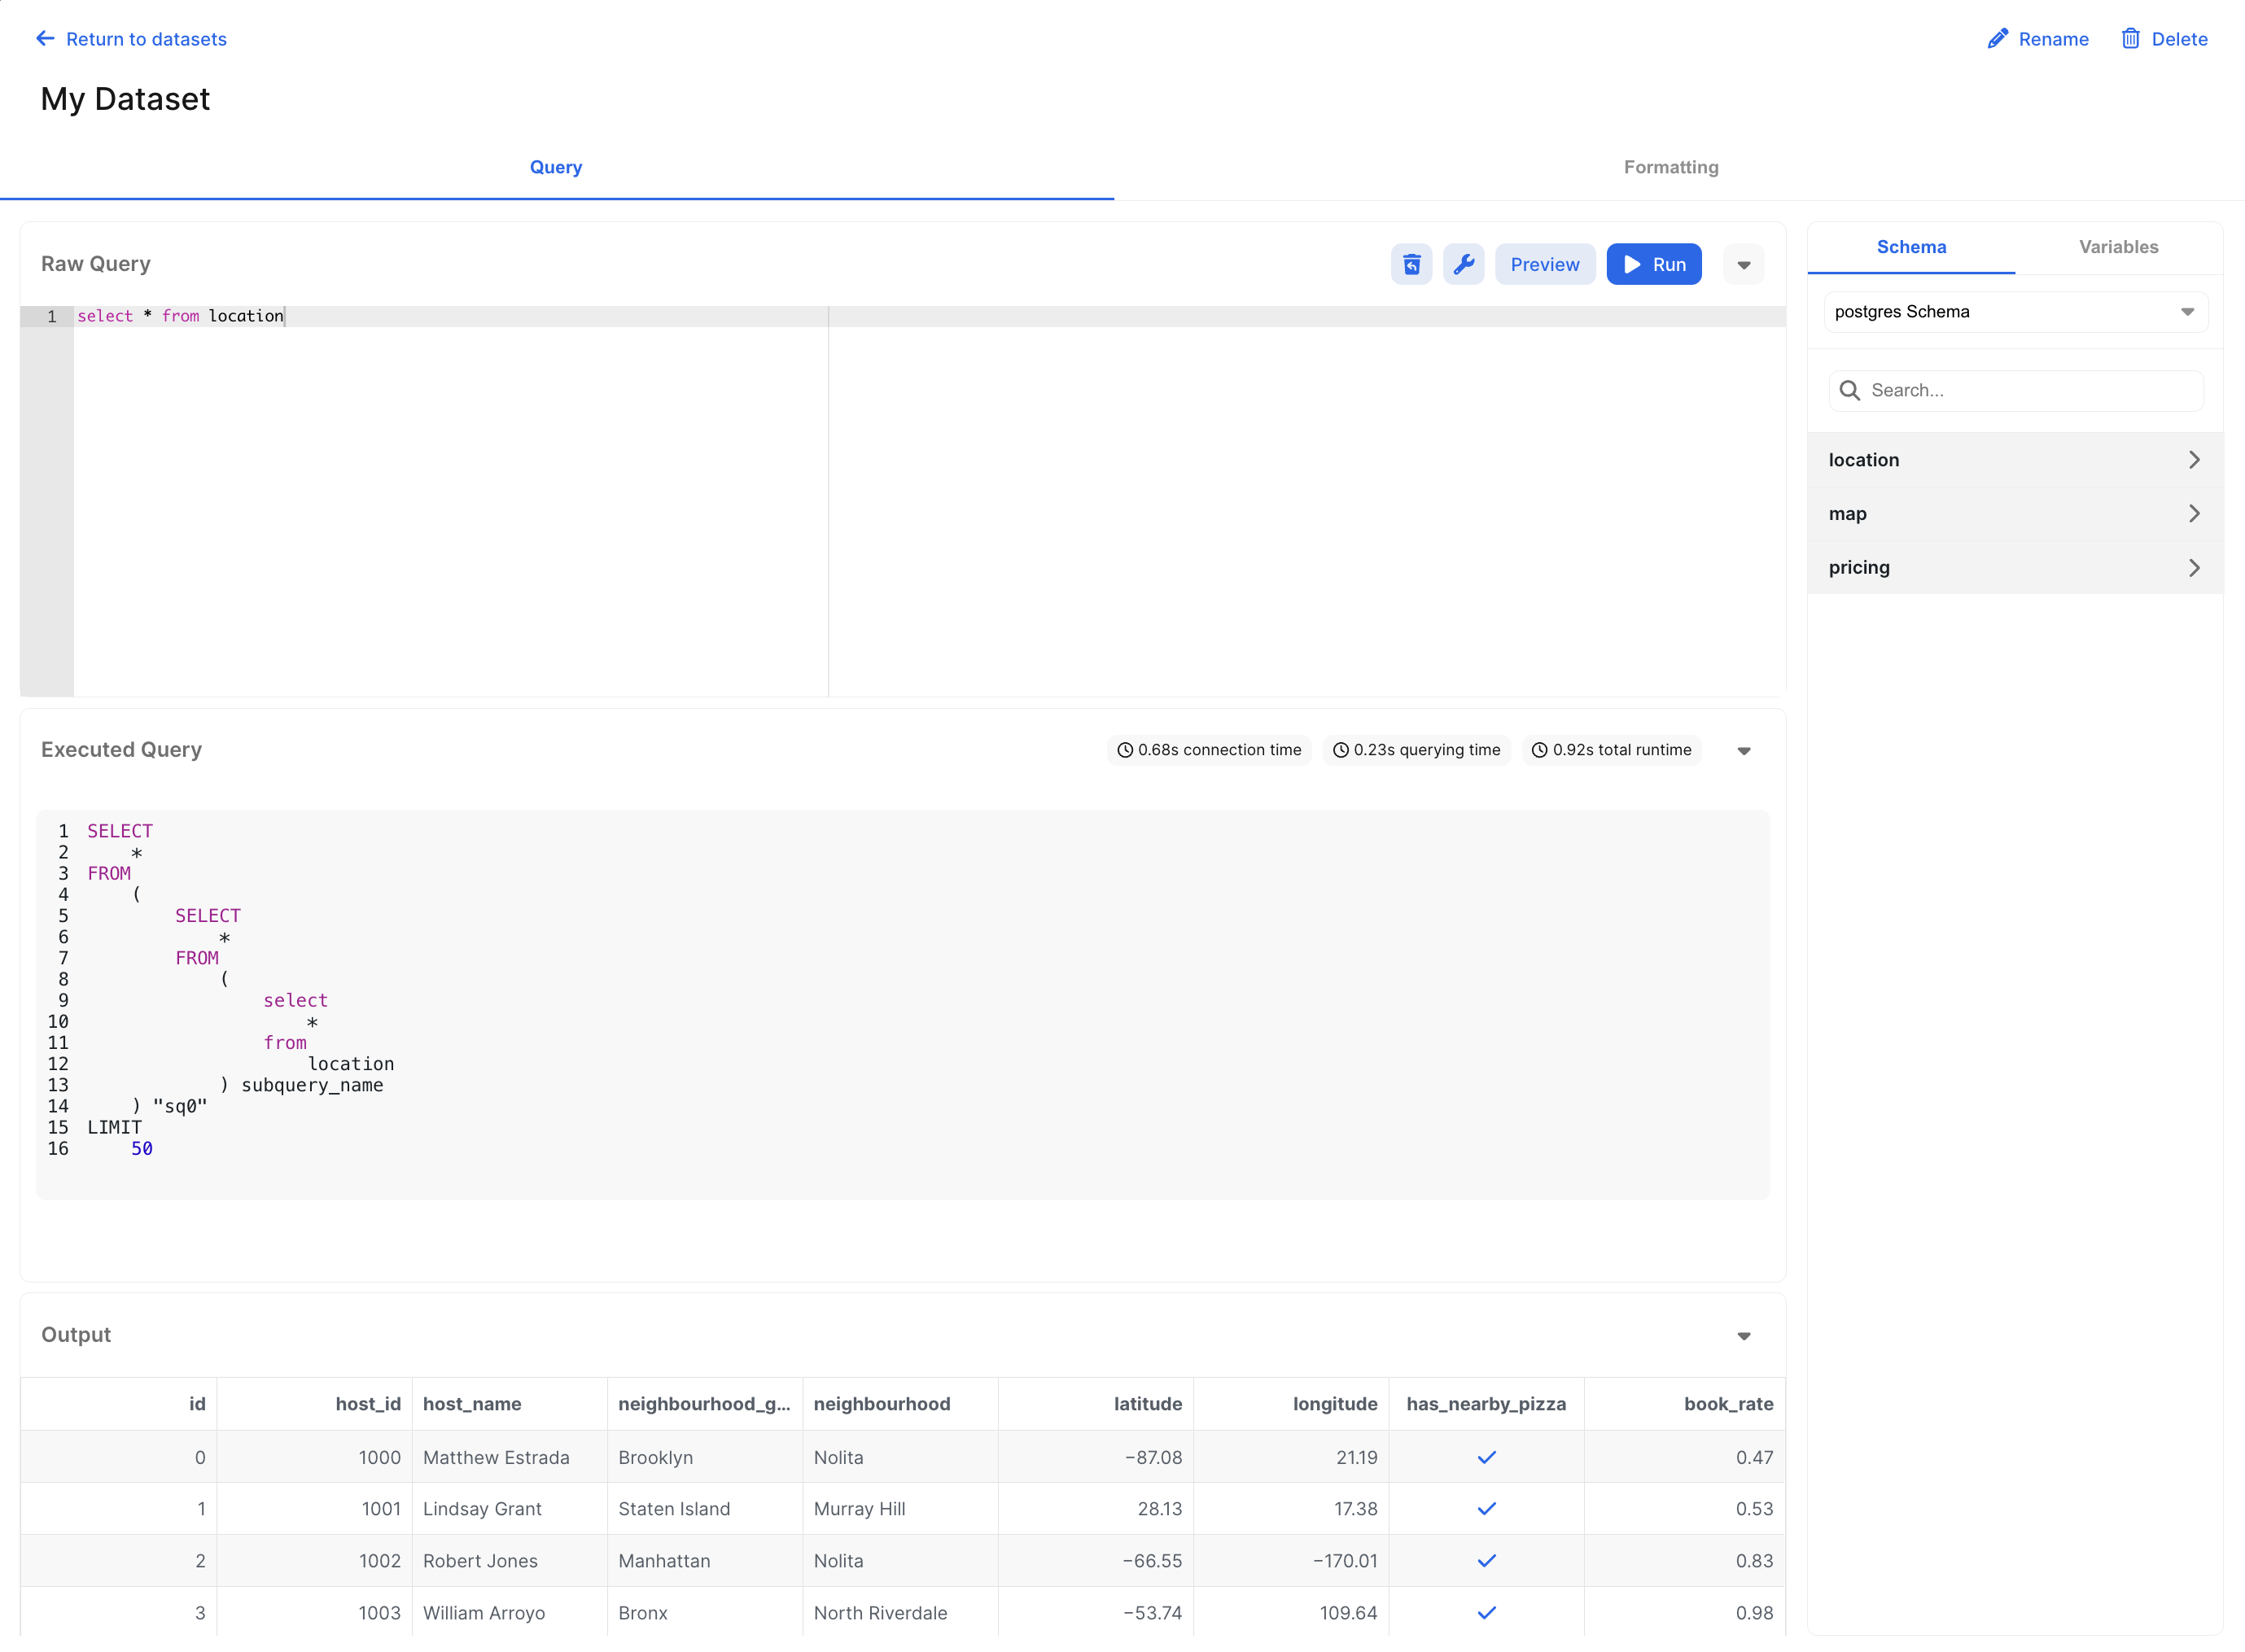
Raw Query
This is where you write your raw SQL query to be executed. You can perform the following actions on the query:- Revert draft: Undo the most recent changes.
- Format query: Apply syntax formatting to the query.
- Preview query: Run the query without saving it.
- Save & Run: Run and save the query. All charts and/or filter elements that use this query will be affected.
Executed Query
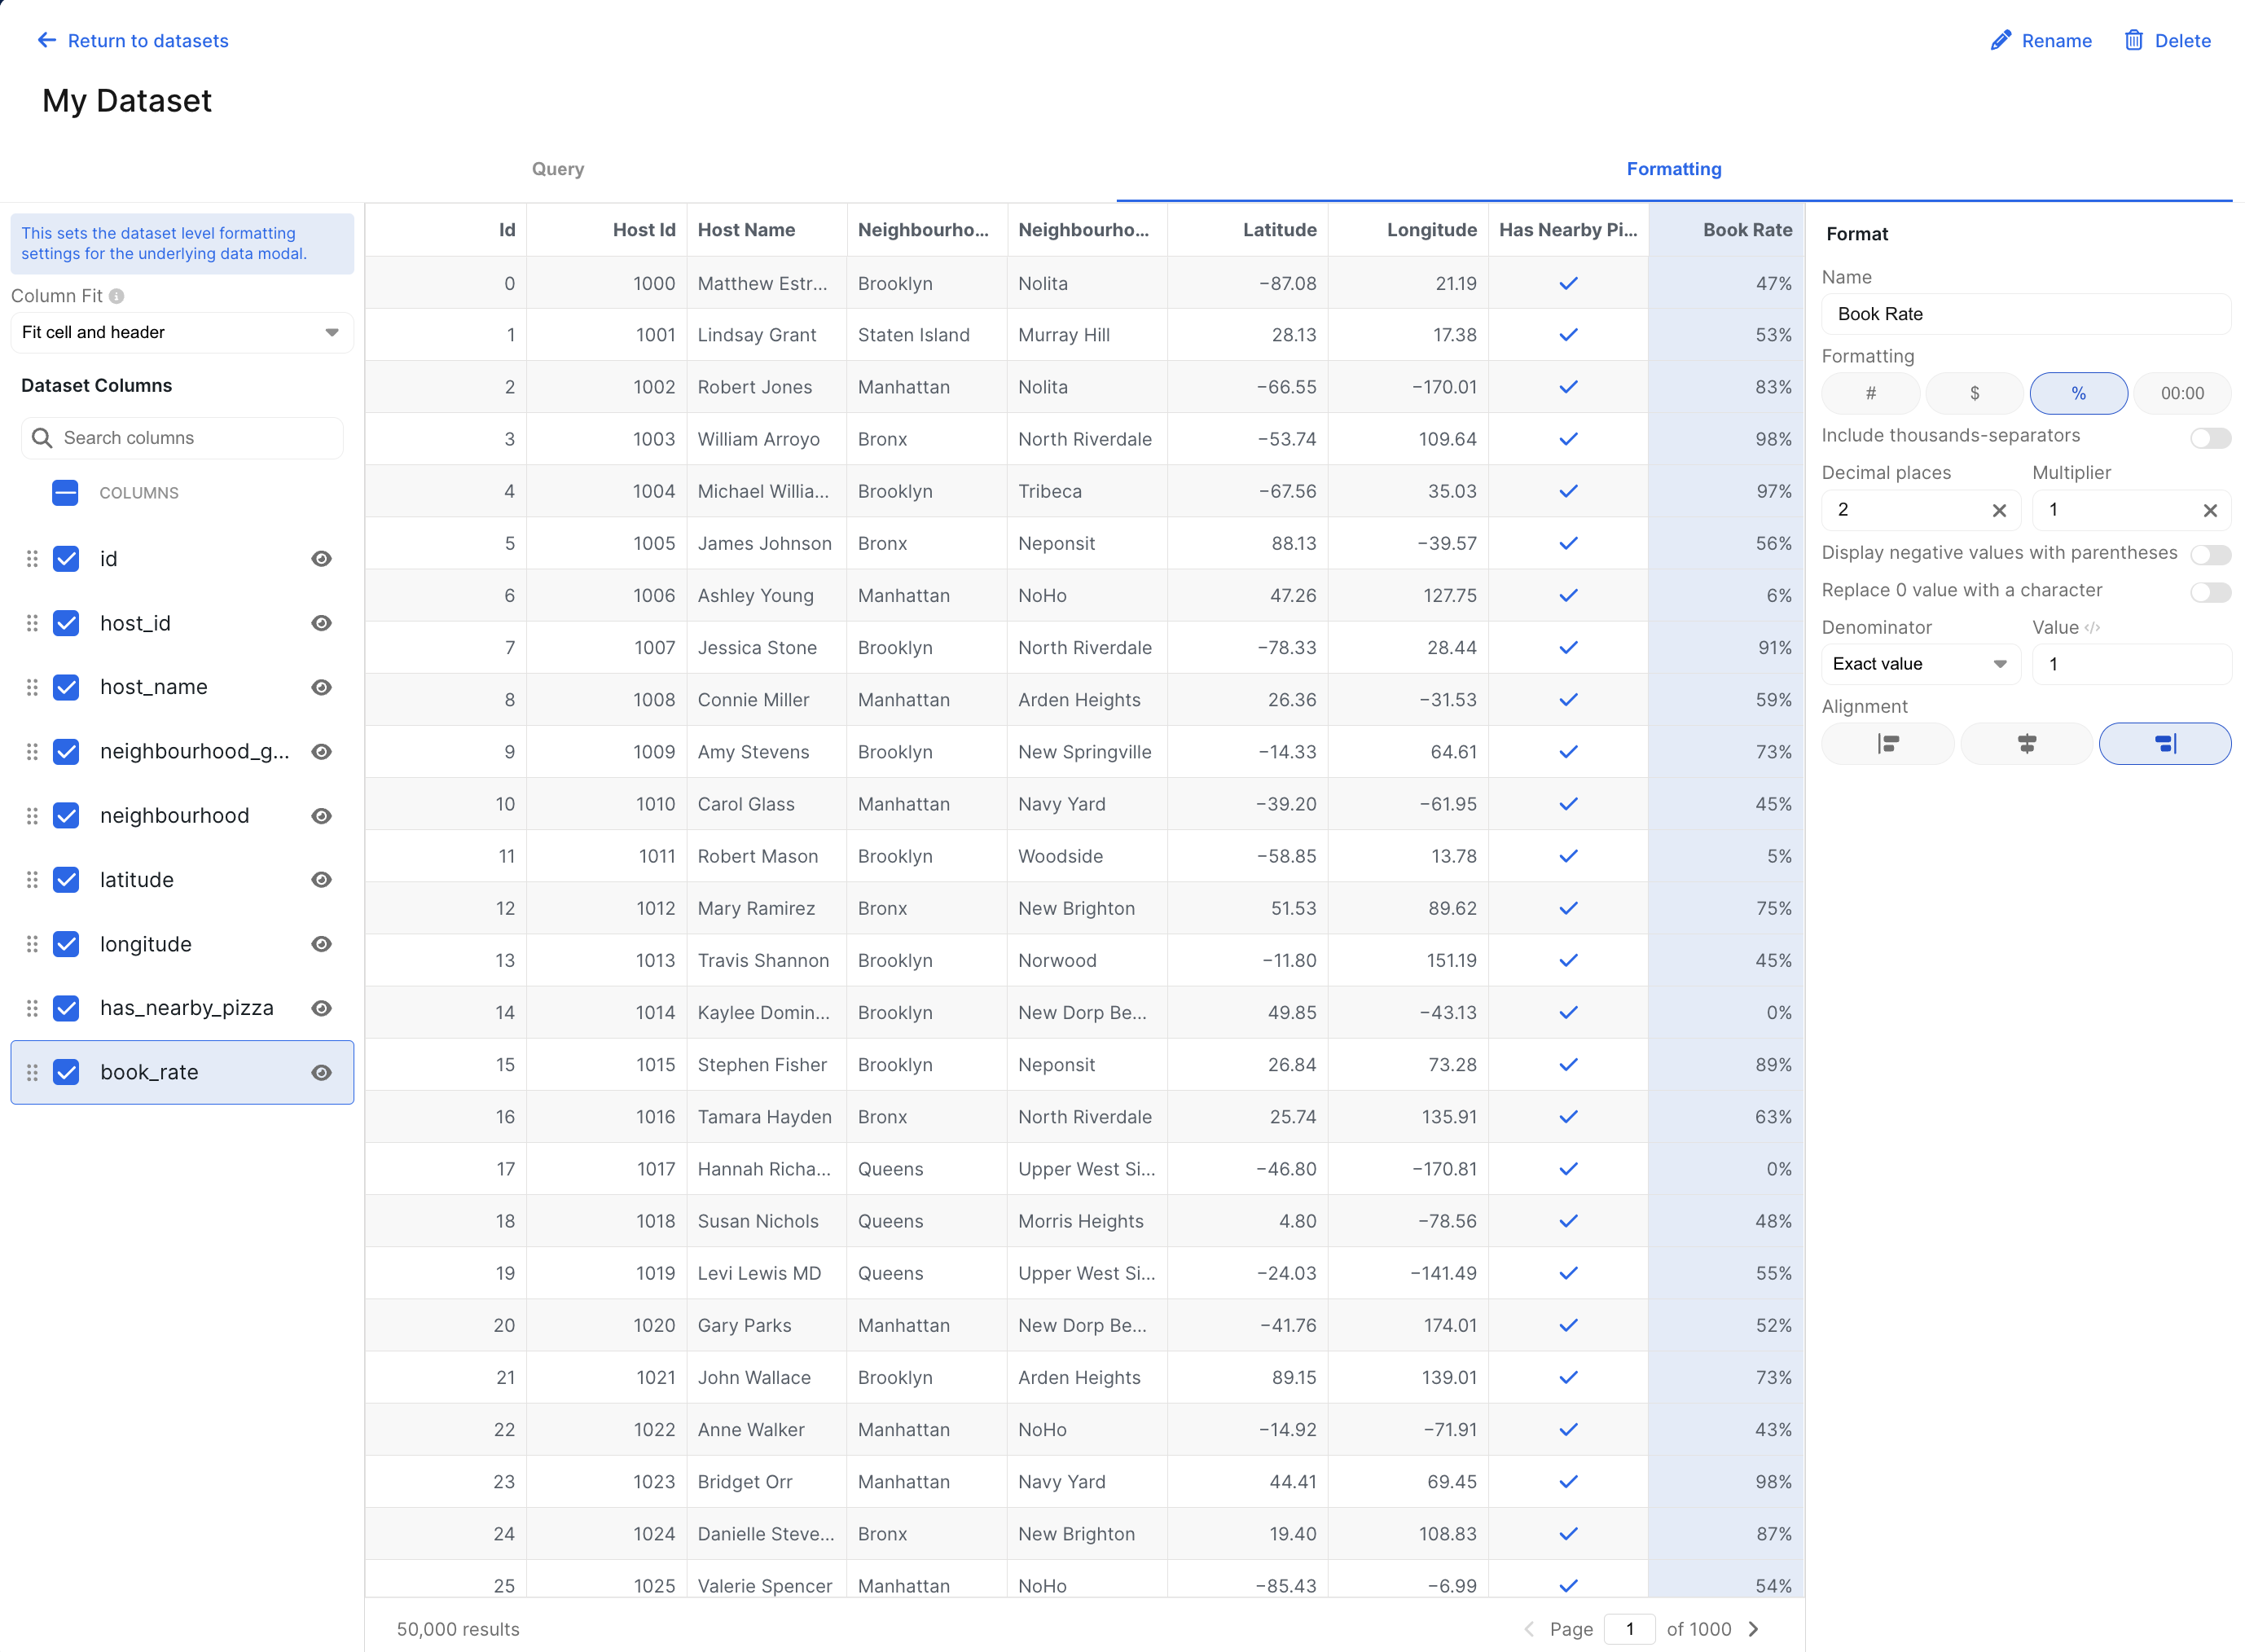
Once a query has been run, you can see the executed version of it. Read more about how to use the executed query for debugging here.Output
This section shows a data table with the result of the executed query. If there are errors with your query, they will be displayed here. If you haveAI enabled for your account, you can get error resolution suggestions here as well.
Schema
This section shows the available columns in each of the tables present in the selected schema. You can also swap schemas here, but doing so may cause your charts to load different data.Variables
This section displays the variables that are available for use in the query. Read more about how to use variables here.Formatting