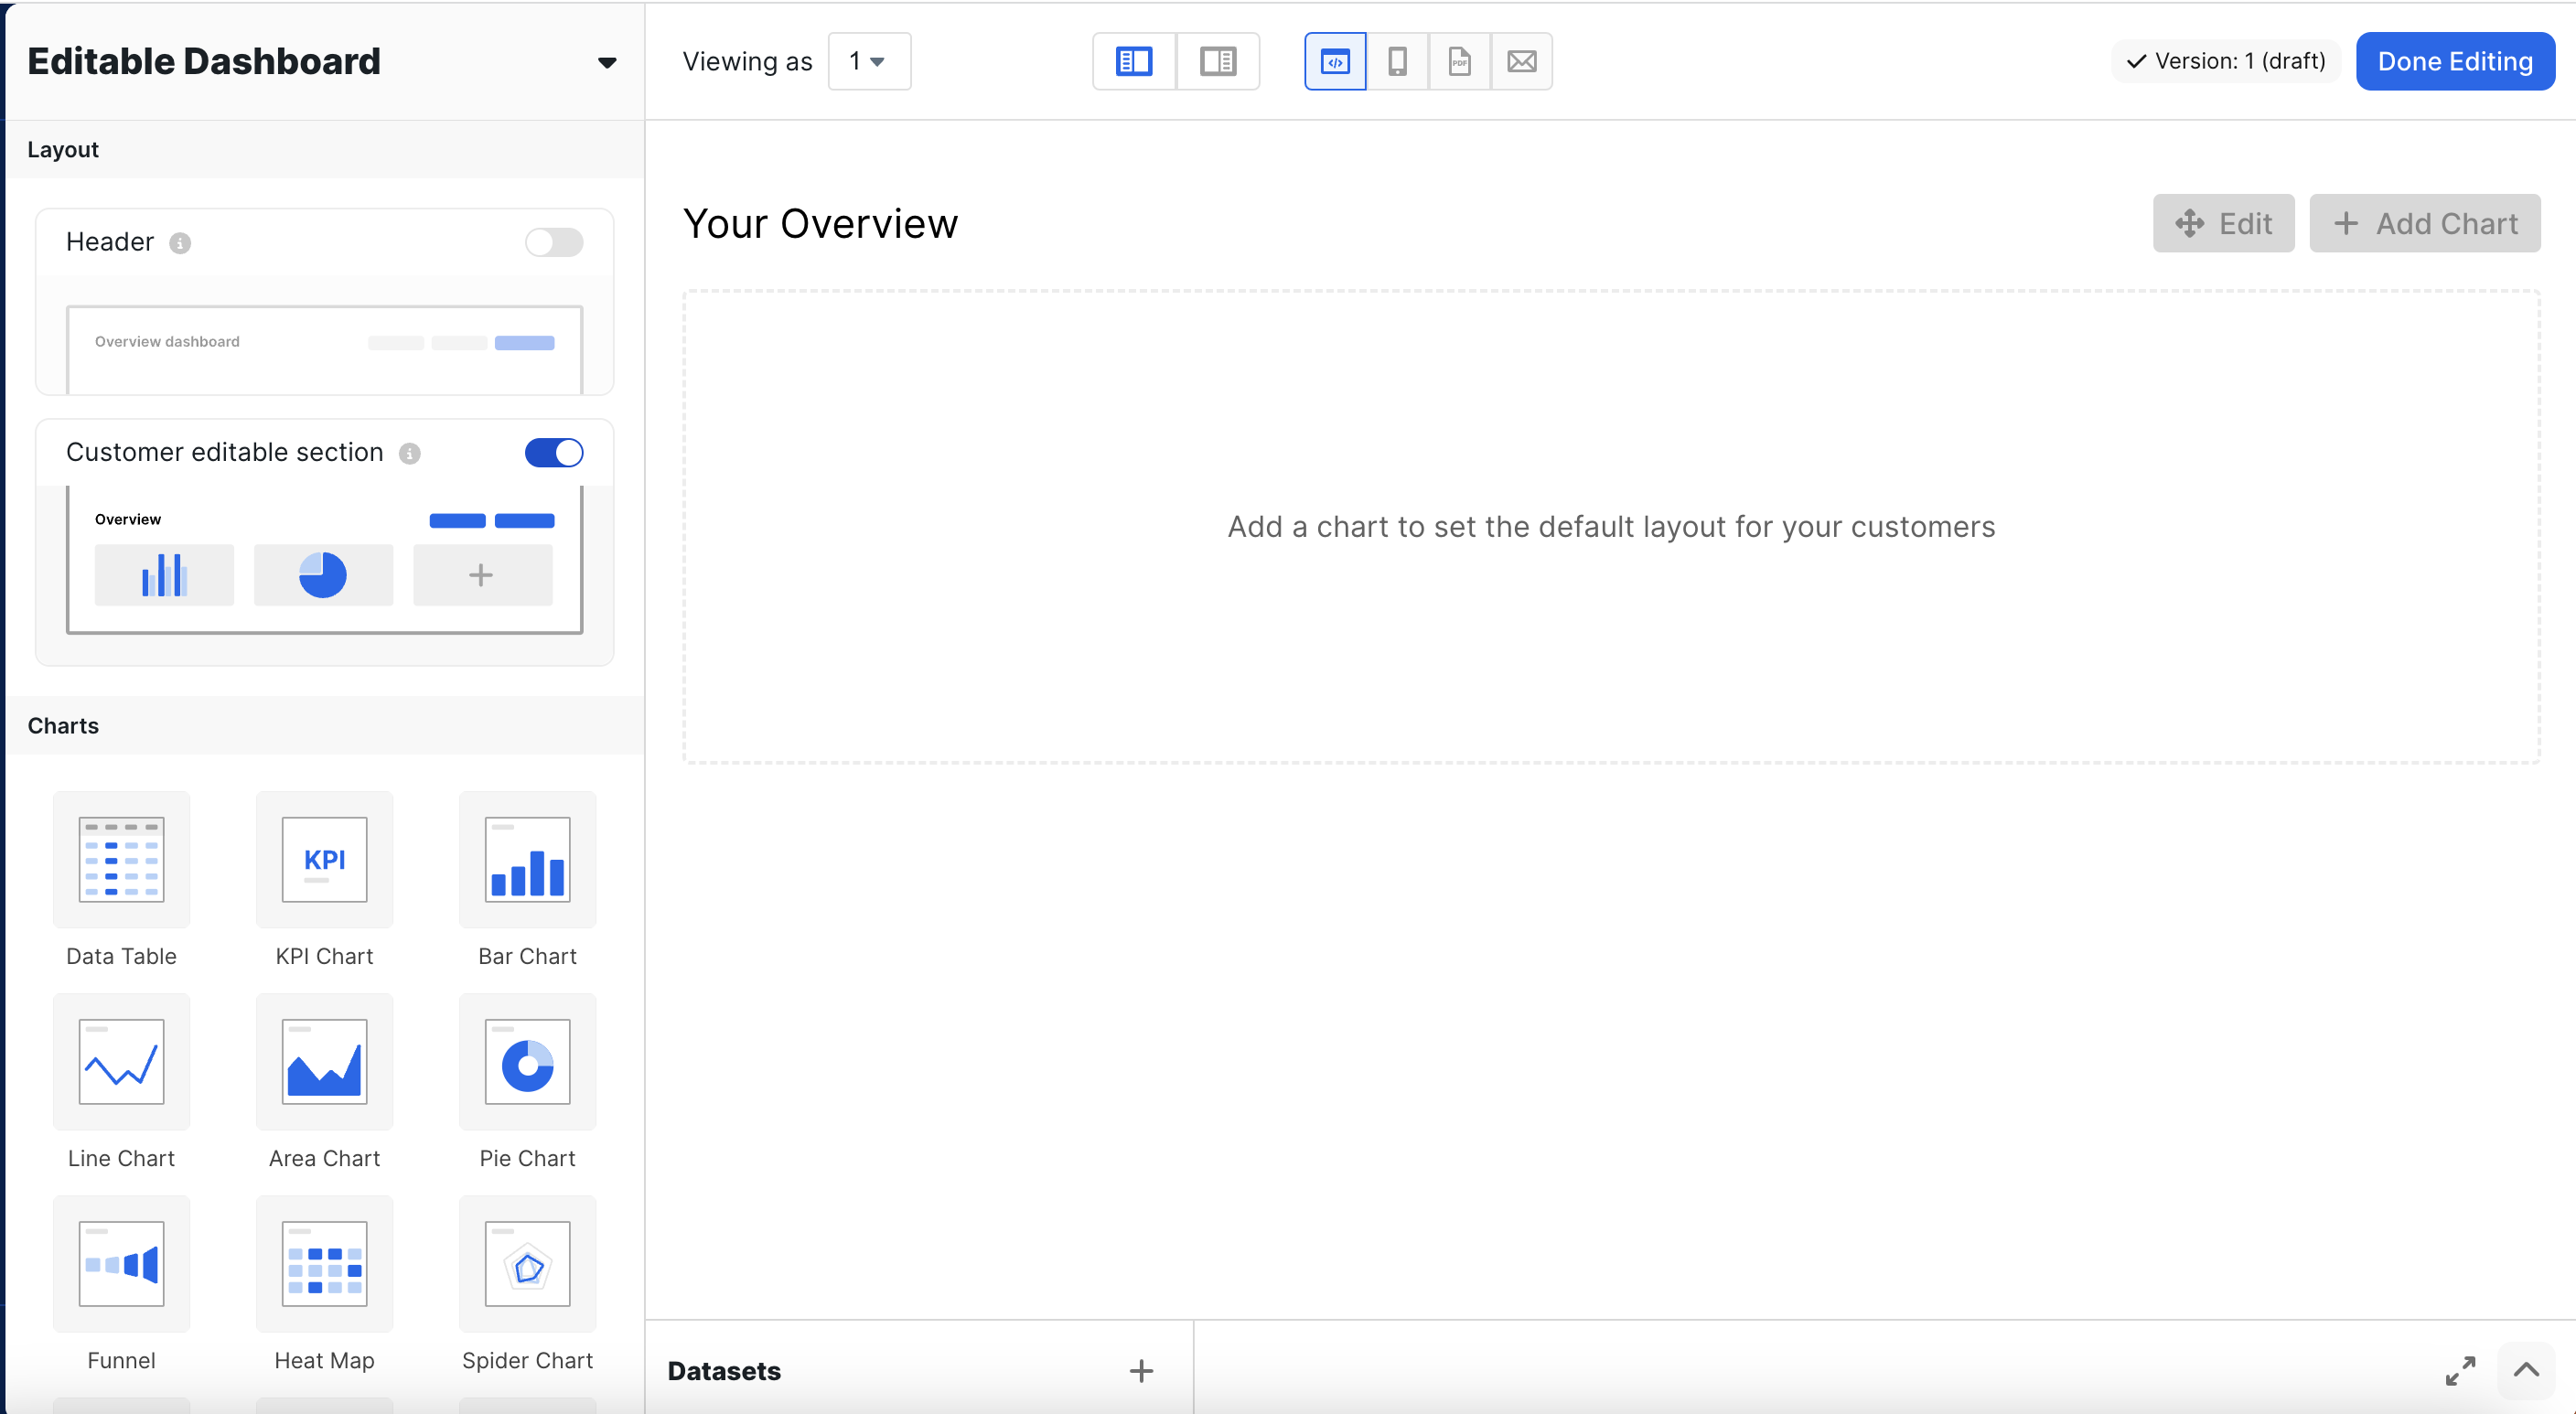
Adding and Editing a Chart
Click ‘Add a Chart’. Now, you can begin creating the chart, exactly how you would with the traditional dashboard experience.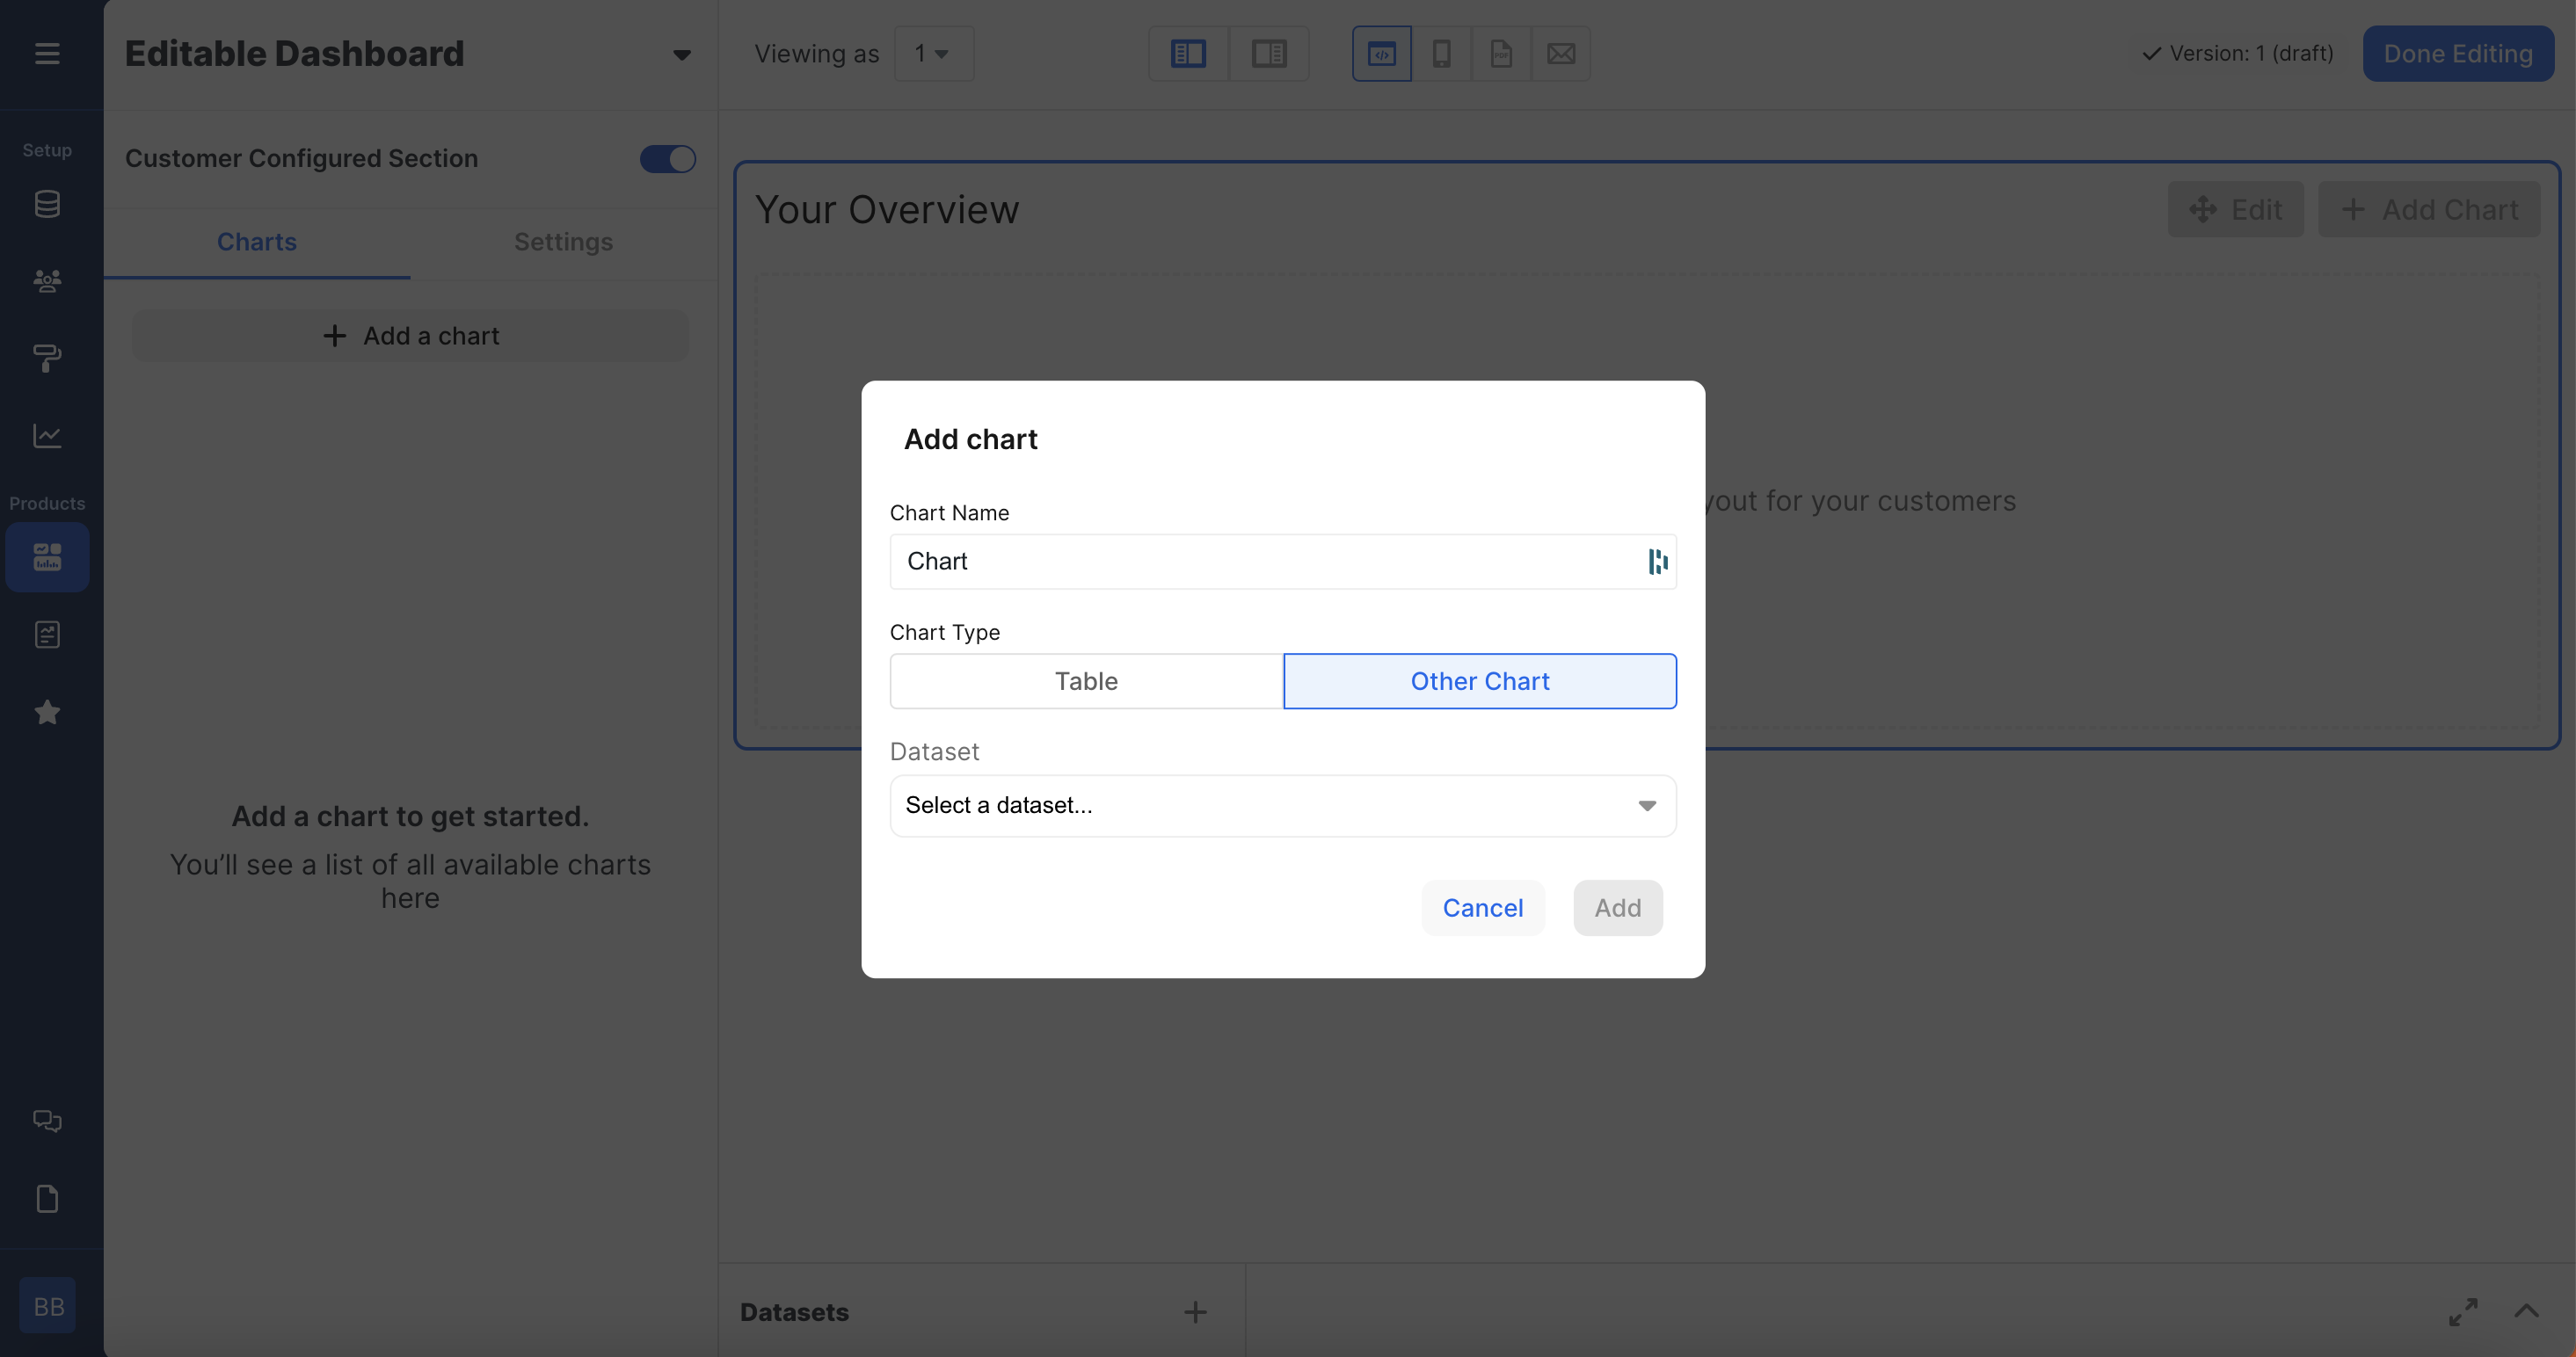
User Permissions
To edit the user permissions on a chart, click the three dots and ‘Edit’. From there, you can change the group tag that the chart is associated with. Each customer can be associated with a Group Tag within the customer object. Typically, group tags will take the form of groups such as Marketing, Sales, Engineering, Leadership, etc.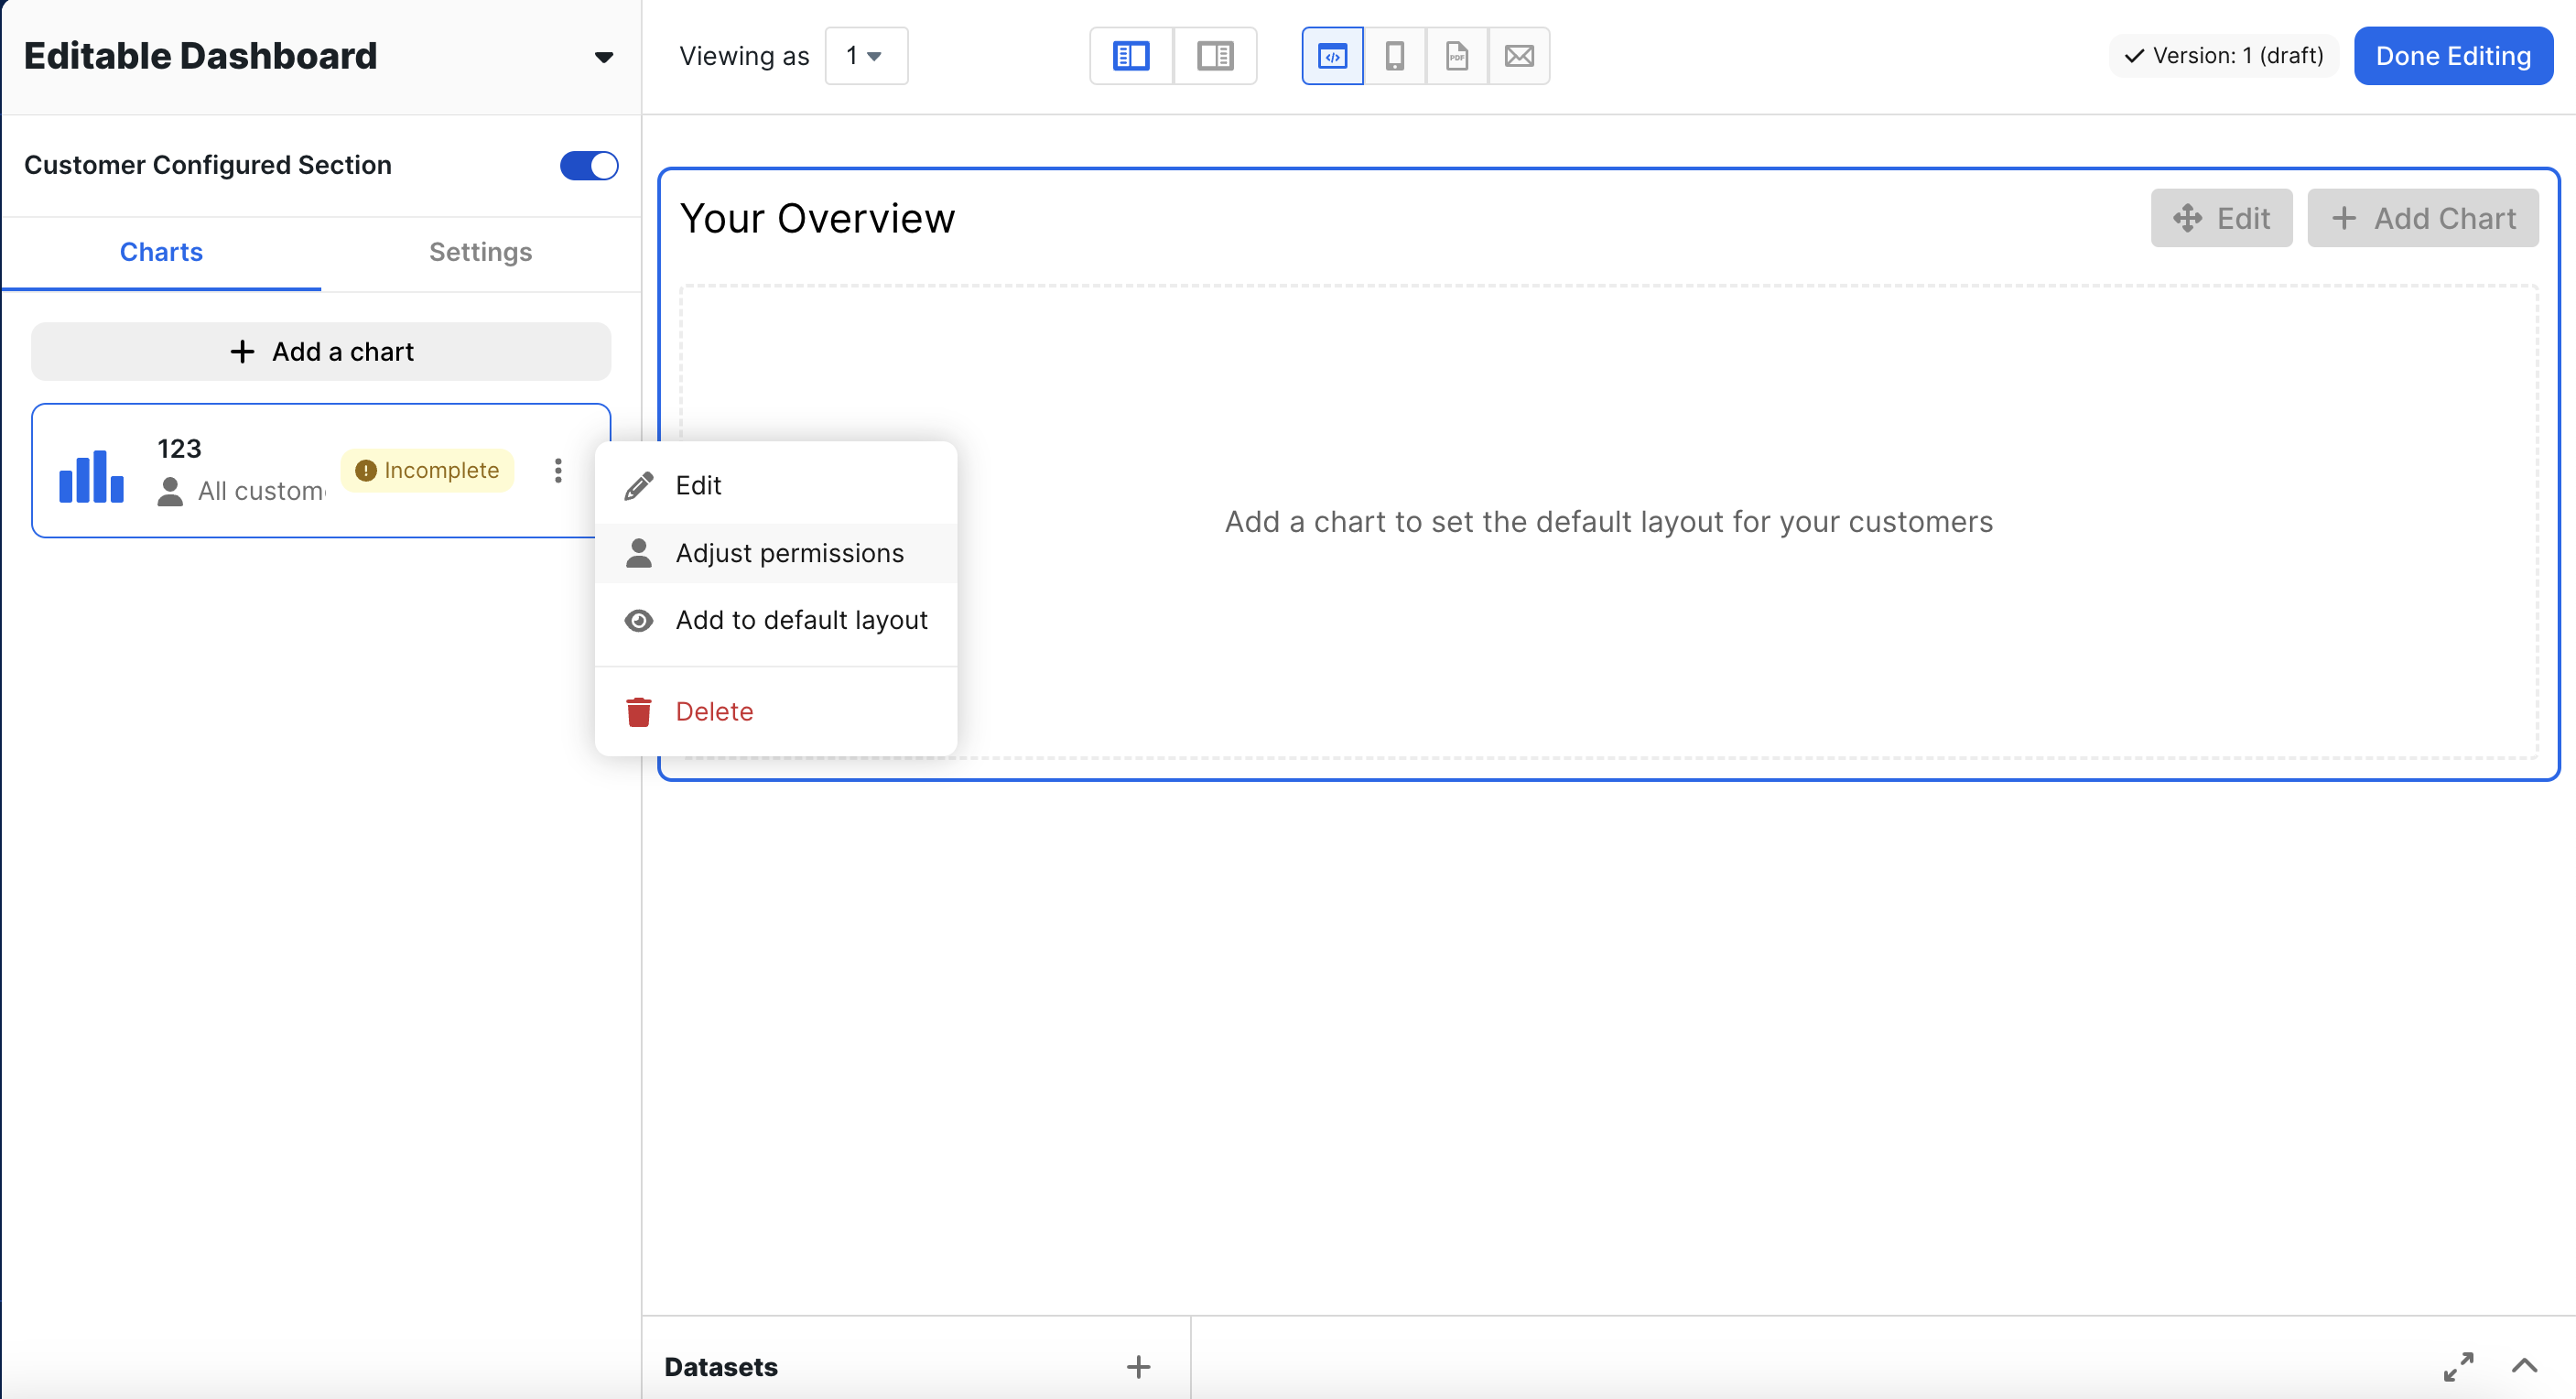
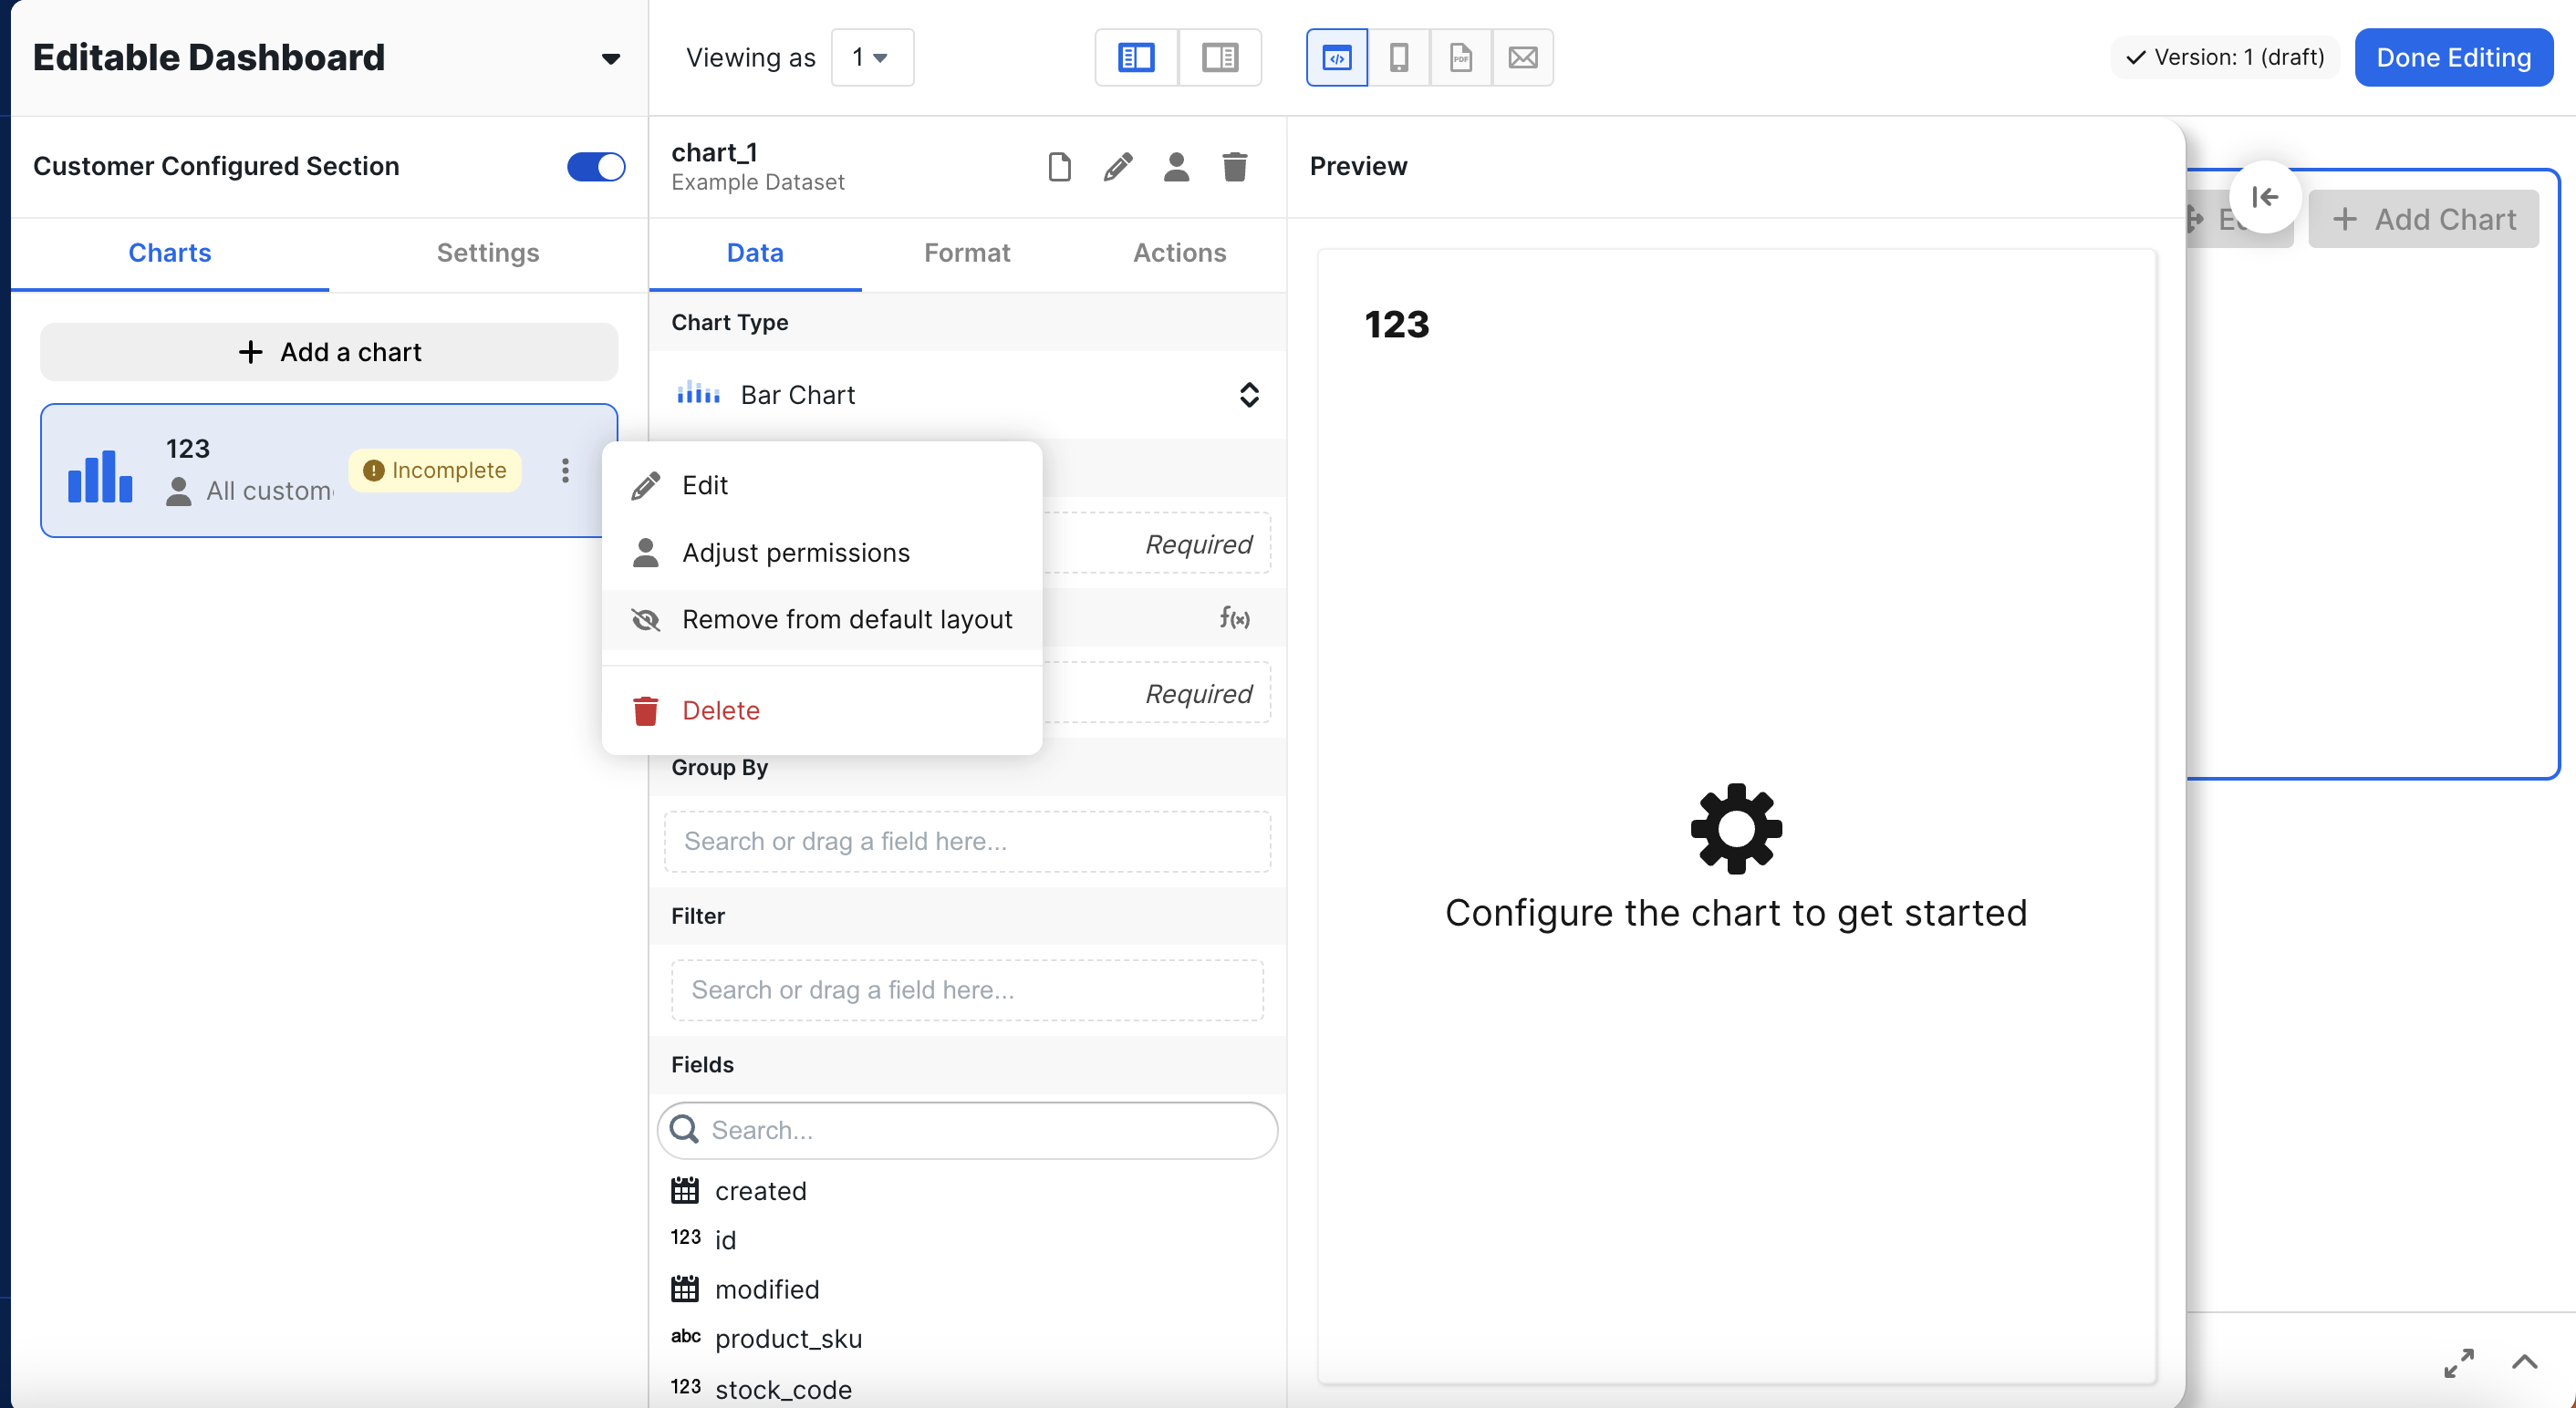
Edit Default Layout
To add/remove a chart from the default layout, click on the three dots and click ‘Add to default layout’ or ‘Remove from default layout’. Only charts available to all customers can be added to the default layout.