Adding a Custom Formula
Supported charts
Custom Formulas can be used on the following charts:- KPIs
- Bar Charts
- Line Charts
- Combo Charts
- Area Charts
- Pie Charts
- Heat Maps
- Funnels
- Spider Charts
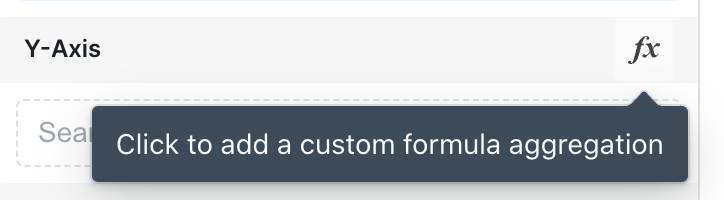
Use a Custom Formula
SUM(price)
SUM(revenue) - SUM(cost)
Edit or Remove a Custom Formula
You can edit the formula by clicking on the icon to the left, and you can delete the formula by clicking on the icon to the right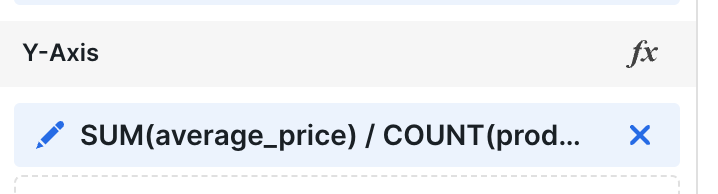
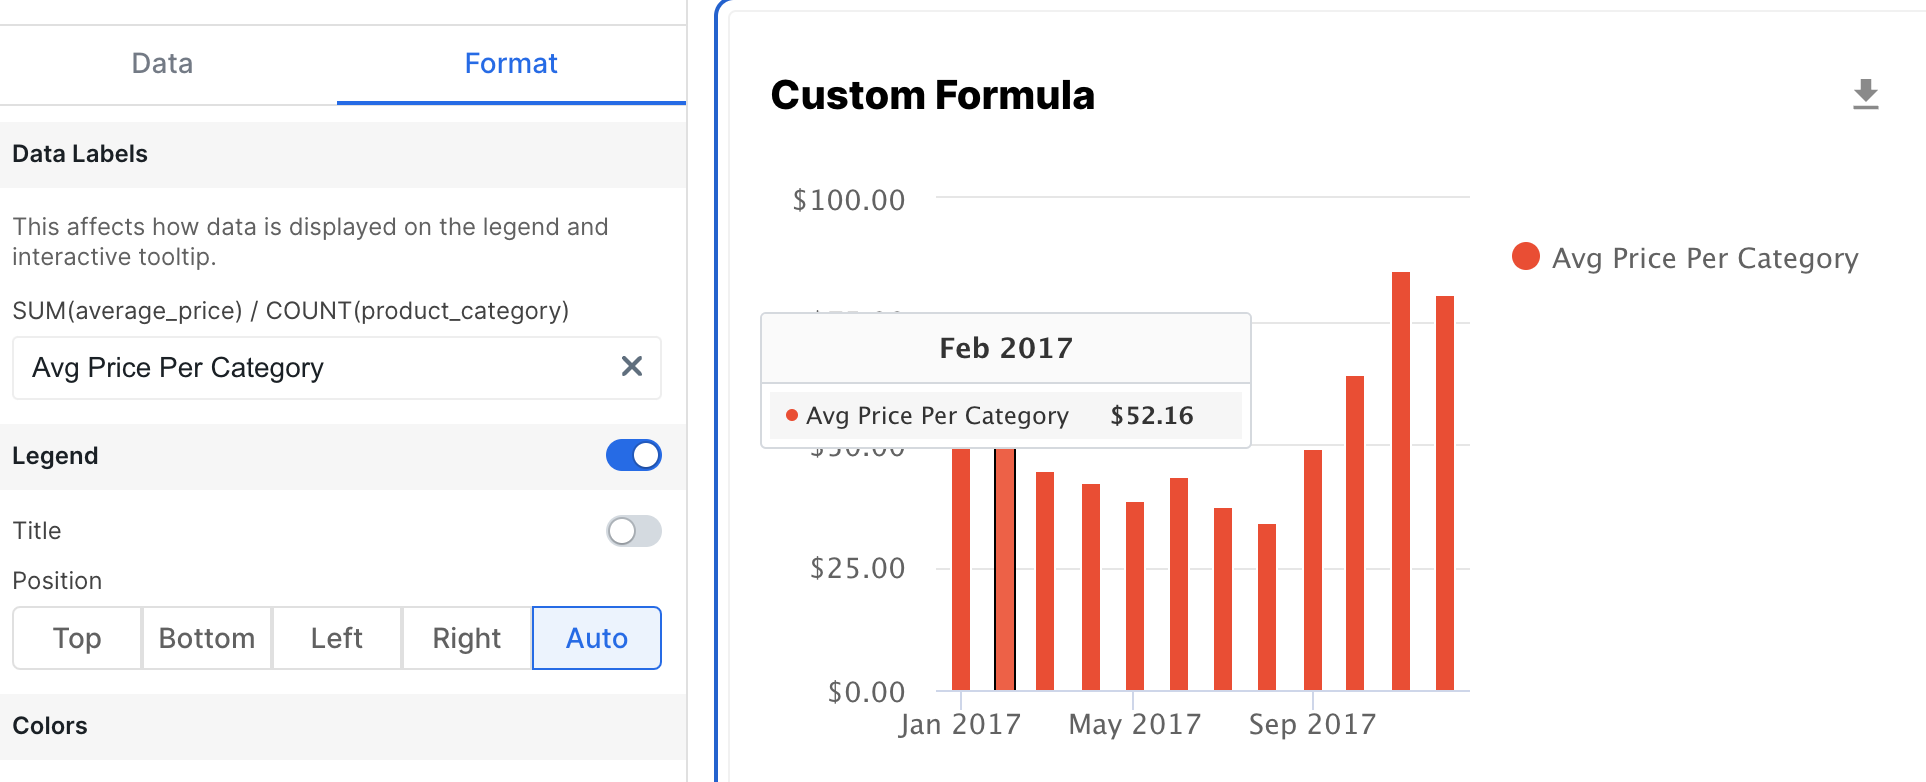
Rename the Formula
You can rename the label that appears in tooltips and legends in the Data Labels section of the Format tab