Adding a Goal
Supported charts
Goals can be added to charts that display data on the two-dimensional axis. Specifically:- Bar Charts (grouped, stacked, and 100%)
- Line Charts
- Combo Charts
- Area Charts
Create a Goal
To create a goal, go to the Format tab and click the ”+” button for the “Goal Line” section.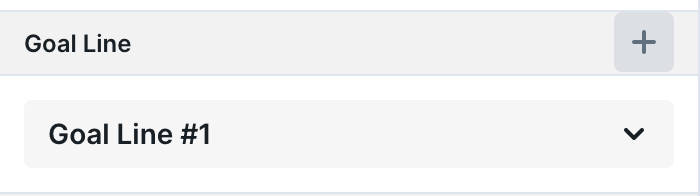
Goal Line
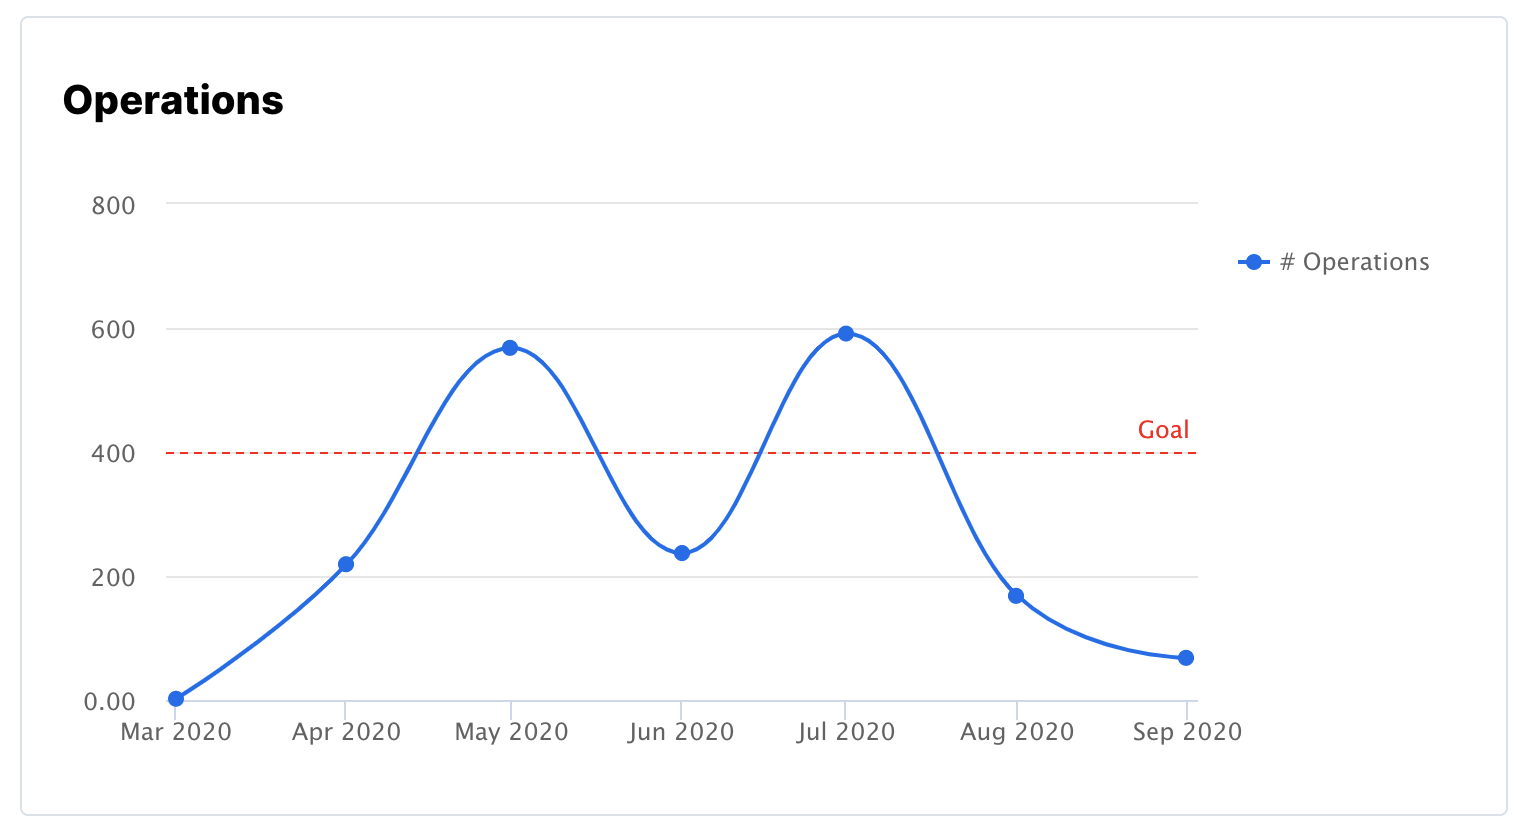
Example
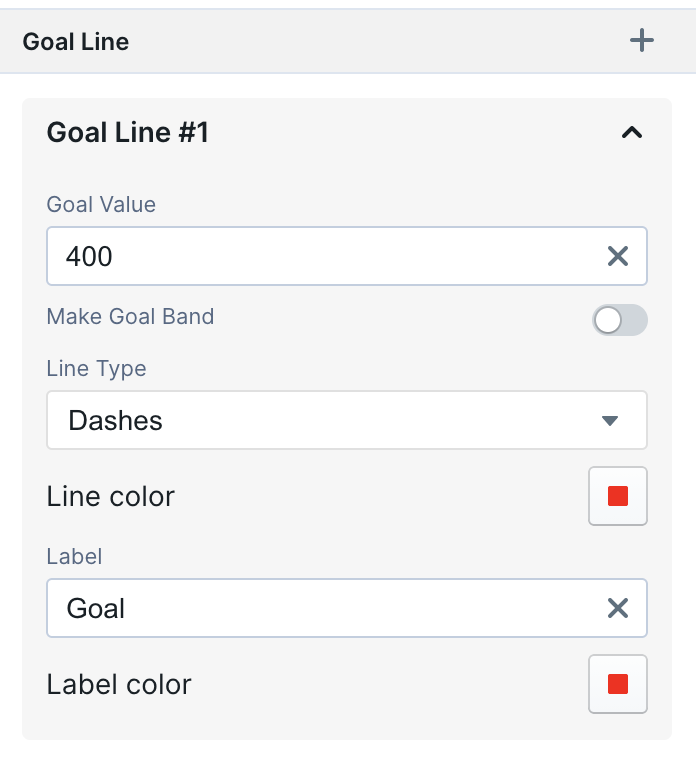
Configuration
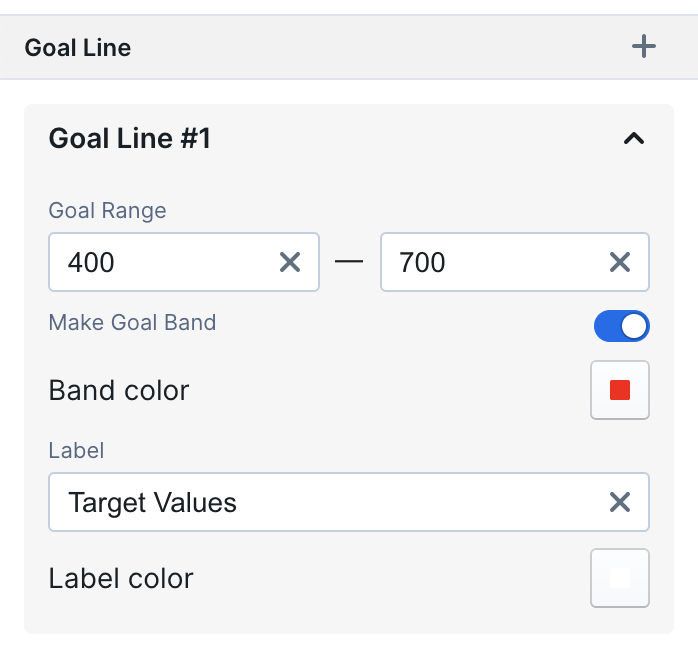
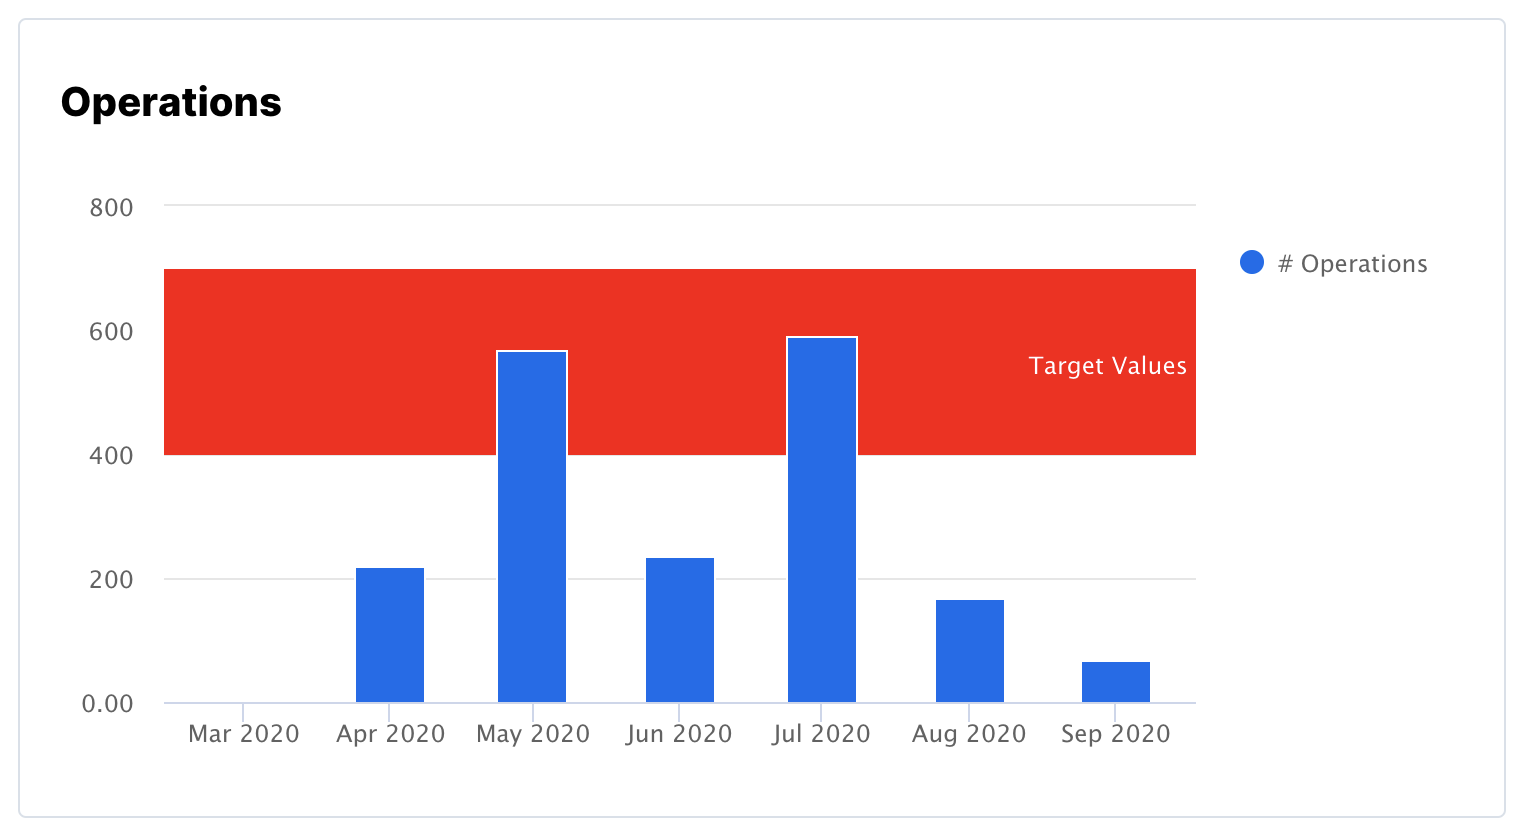
Goal Band
Example
Configuration