Data Configuration
Chart Type
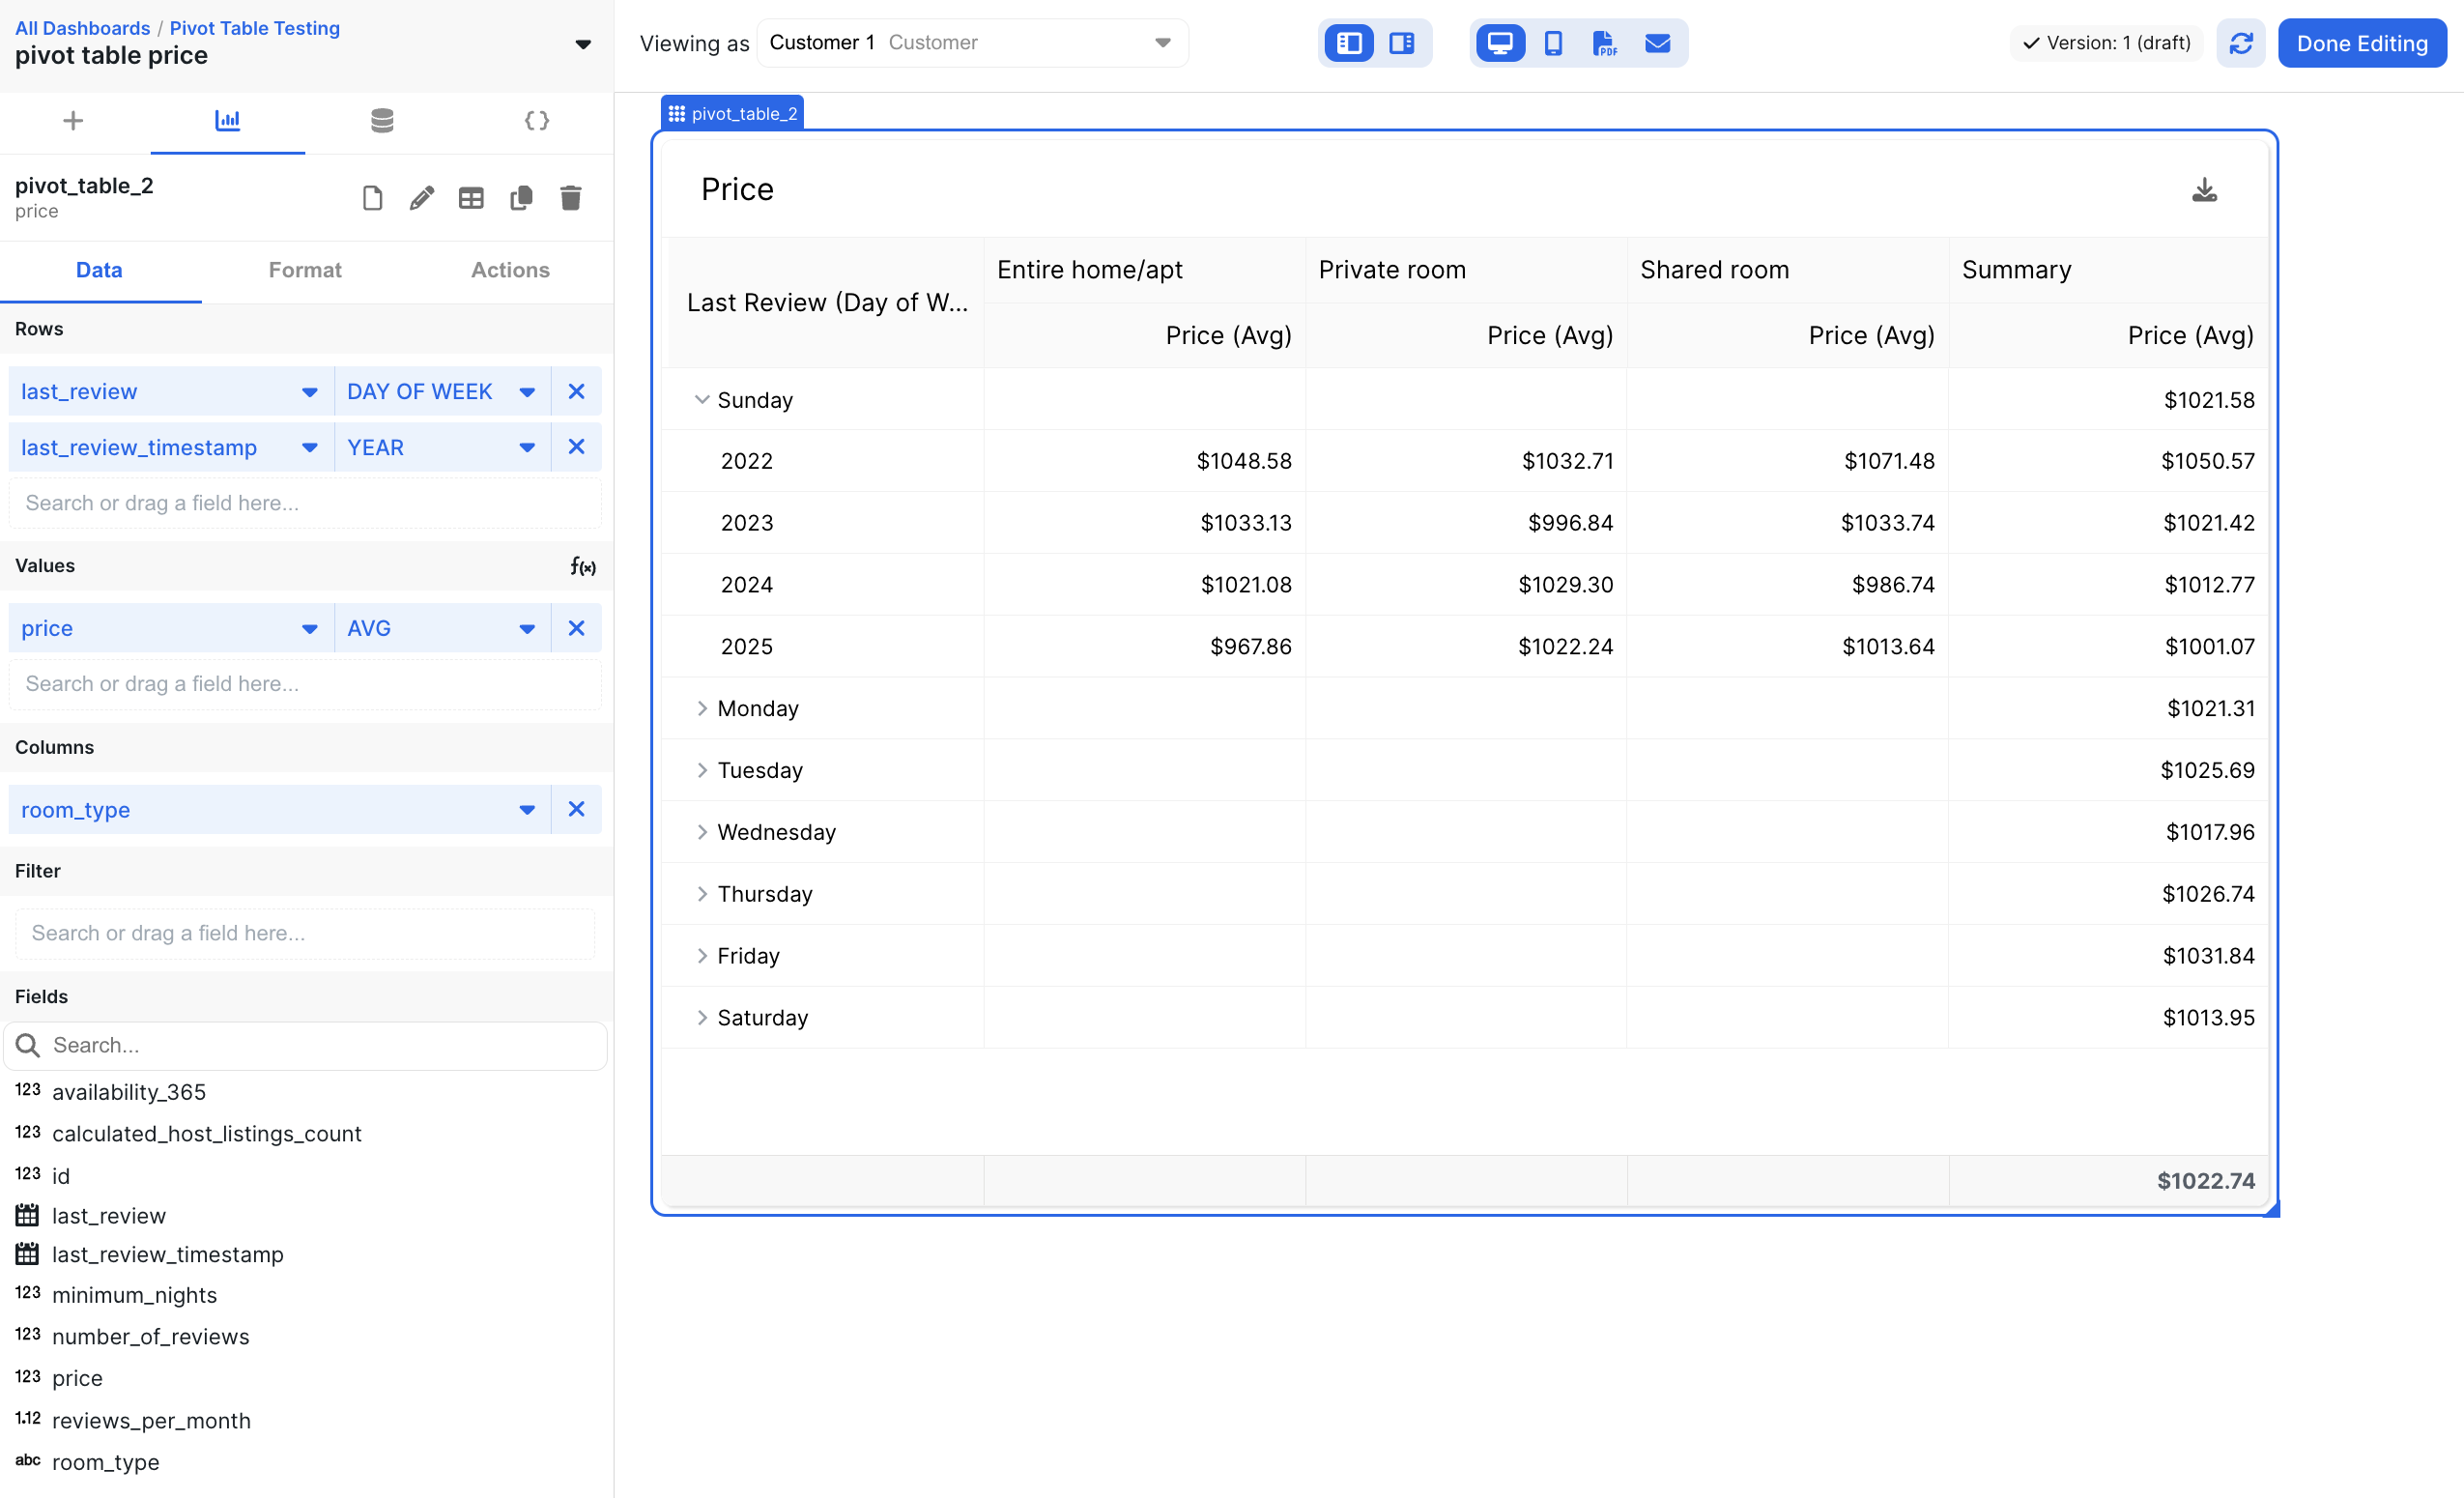
You can read about this section here.Rows
Define what Values are aggregated on. When multiple rows are specified, a collapsible list dropdown is automatically applied. An example input here could be ‘Salesperson Name’, which would create a row for each salesperson. Multiple rows could be ‘Region’ followed by ‘Salesperson Name’, which would create a collapsible list of regions and the salespeople within them.Values
The values aggregated by Rows and Columns. An example input here could be ‘Sum’ on ‘Contract Value’.Columns
Defines an additional parameter to calculate the Values on that shows up as columns in the table. For example, this could be ‘Month’ on ‘Contract Date’ to get columns for each month. For example, we could calculate total sales by salesperson by month by putting a ‘Month’ aggregation on ‘Contract Date’ in the columns section, ‘Salesperson Name’ in the rows, and ‘Sum’ on ‘Contract Value’ in the Values section.It is possible to have multiple rows and multiple values
Filter
Read about theFilter section here.
Formatting
Header
Read about theHeader section here.
Column Formatting
You can set the title of the aggregation for each Value. Additionally, you may format the values. Read about theValue Formatting section here.
No Data Configuration
Read about theNo Data Configuration section here.
Enable Download
Read about theEnable Download section here.
URL Link
Read about theURL Link section here.
Summary Configuration
Summary configuration will render an additional column at the end of the table, displaying the summary of each row’s aggregation data over its pivot column values. For example, if you have an aggregation in your table, a summary would show the average across all pivoted groups. Note that this is only available on the new data connector (called FIDO) and requires rows, values, and aggregations to be defined in your chart configuration.