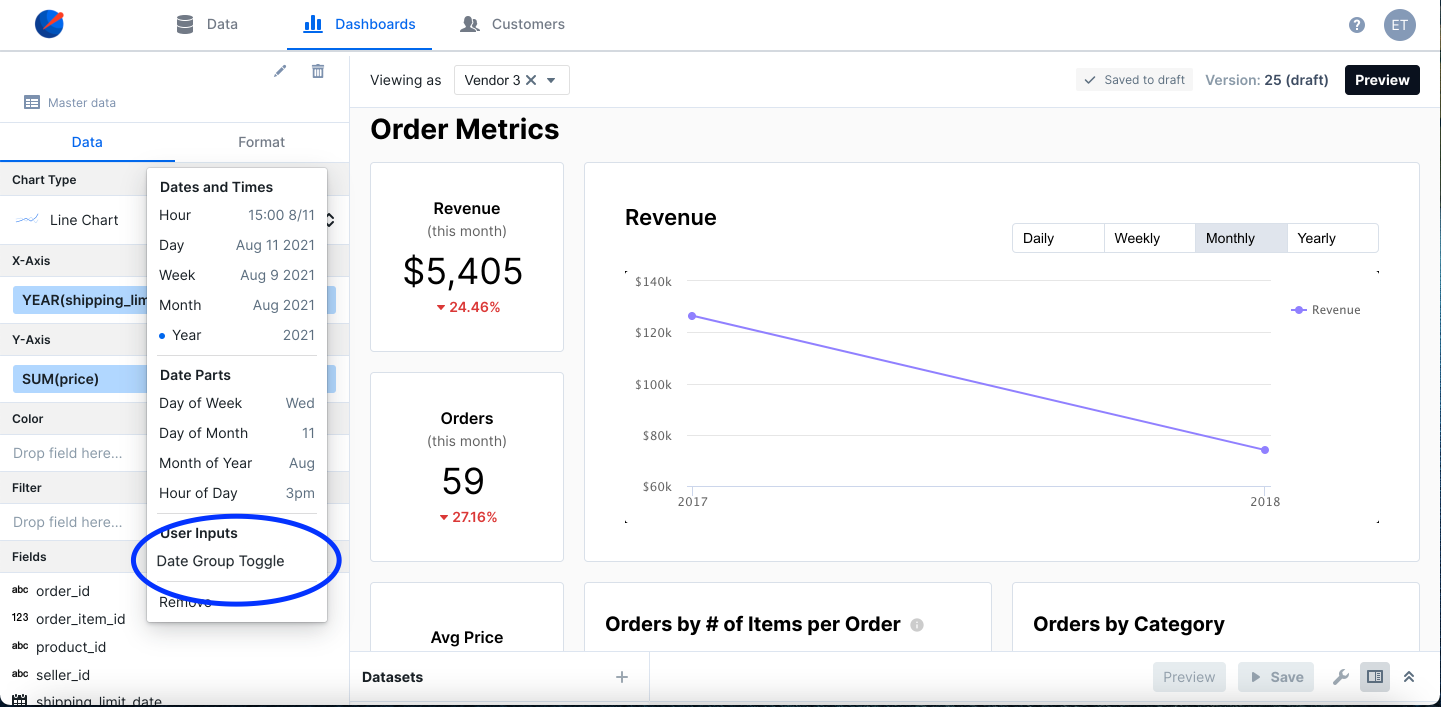
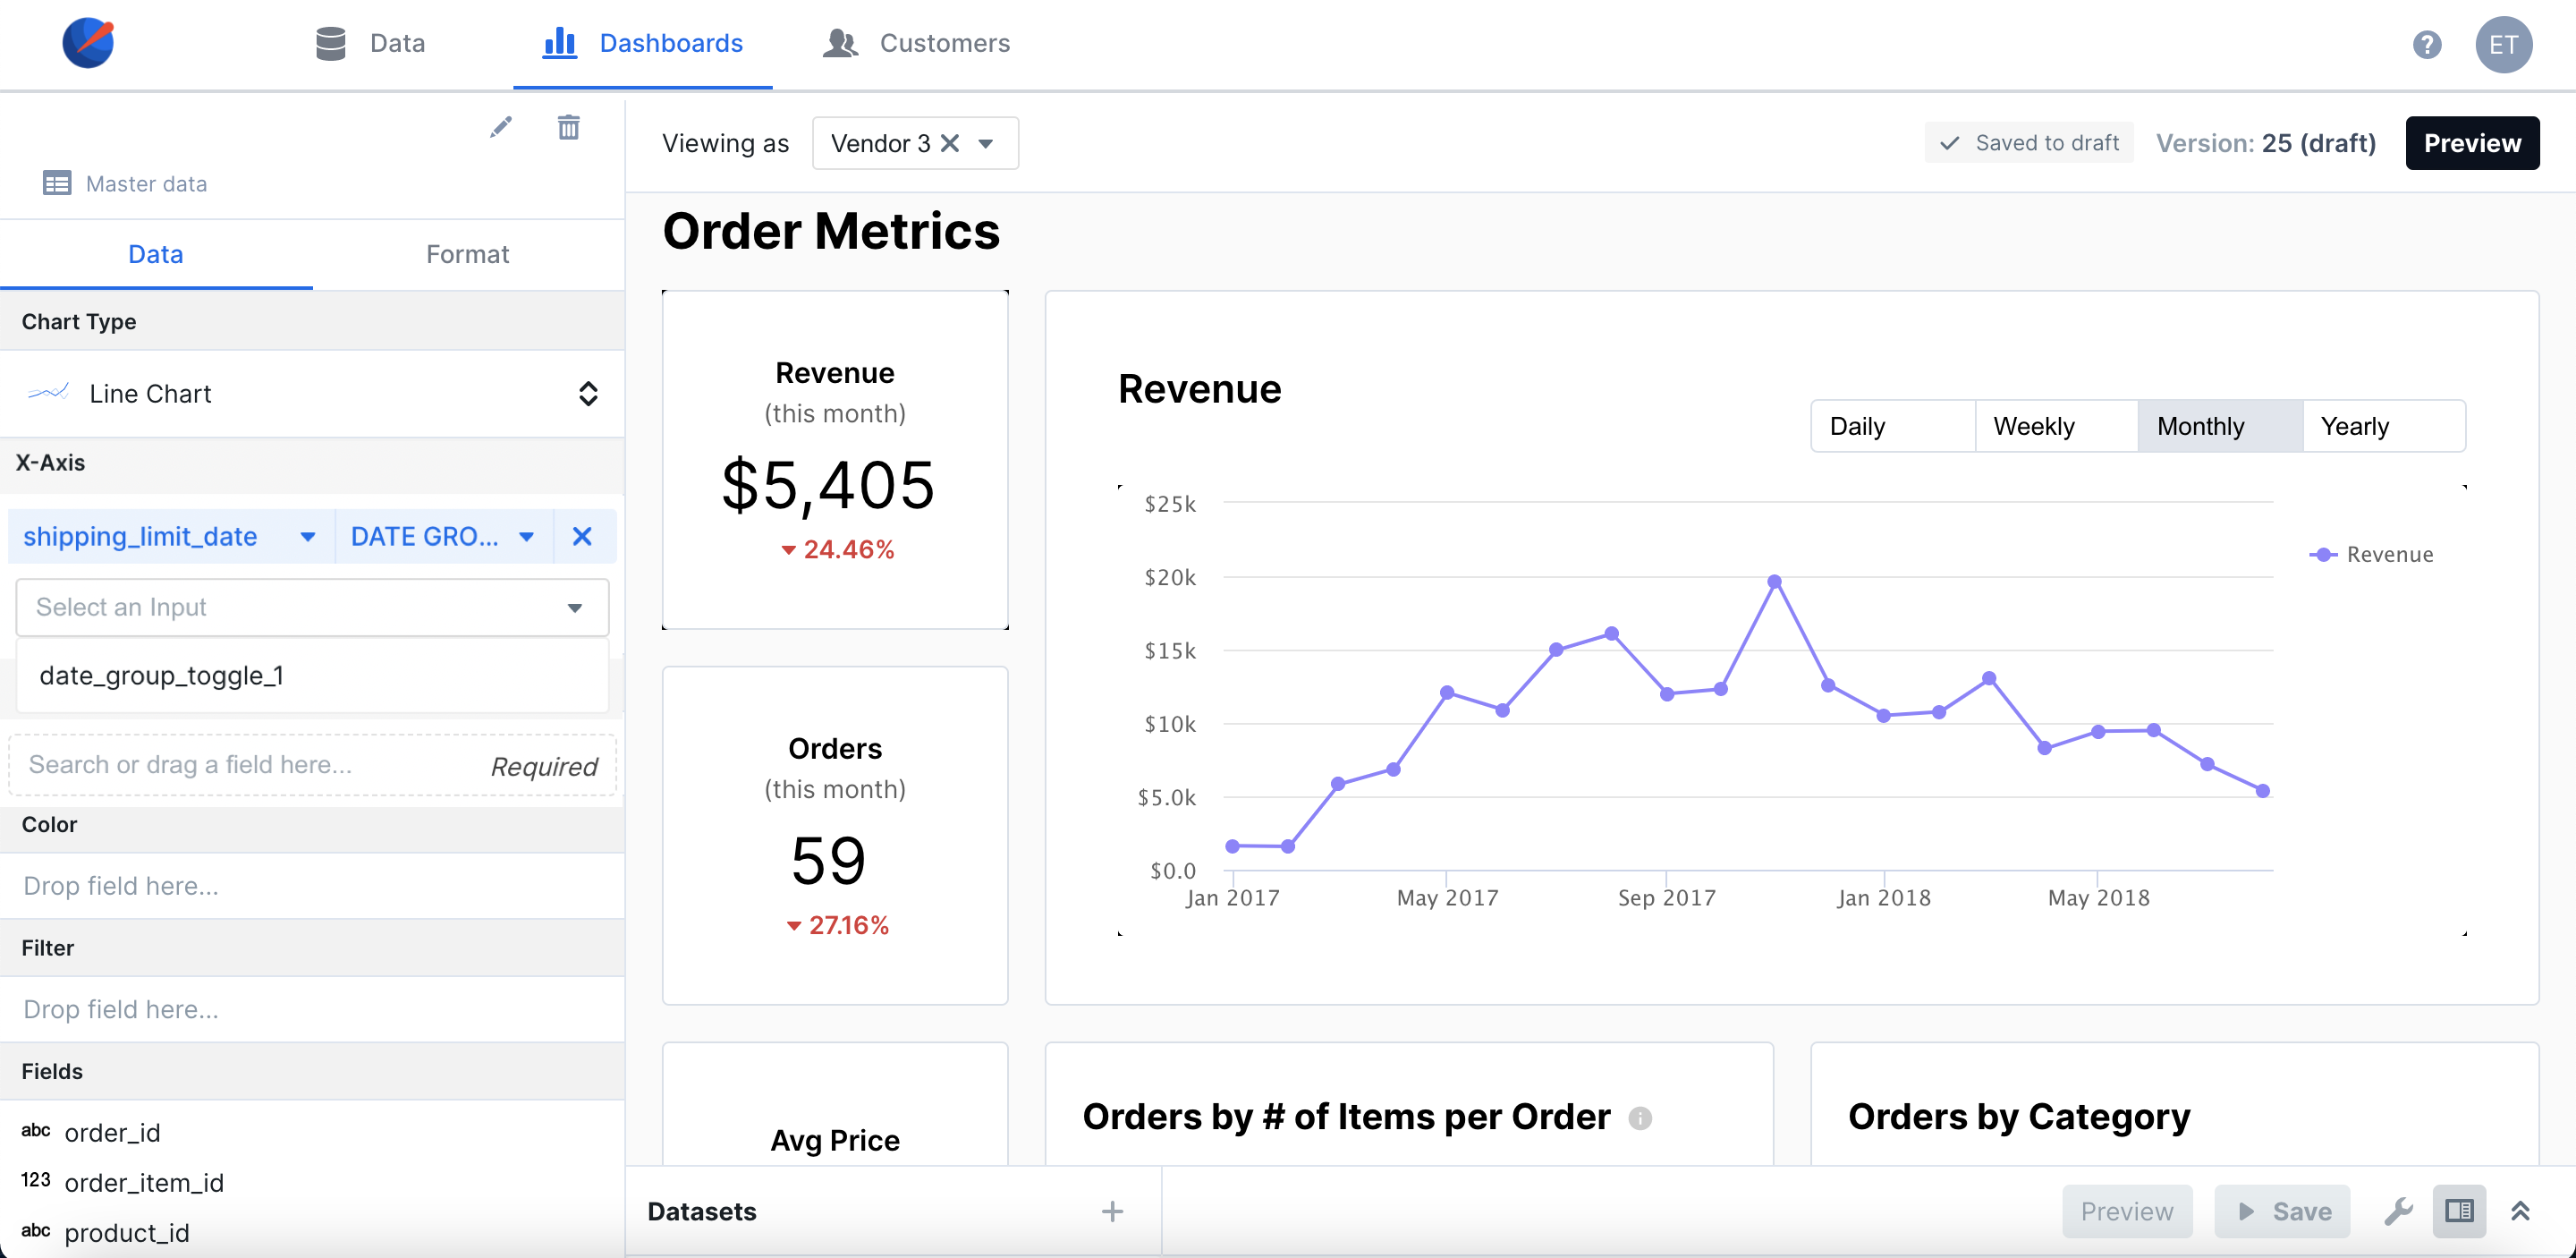
The date group toggle can only be linked to certain charts such as bar charts
and line charts. It also requires a the data to be grouped by a date field.
Configuration
Setup
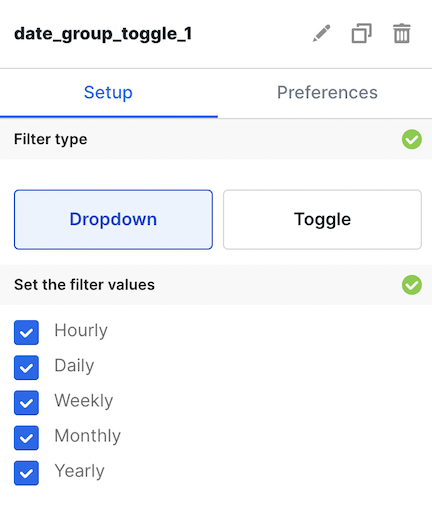
Preferences
Basic Configuration
Available by accessing theSetup and Preferences tabs
| Configuration Option | Description |
|---|---|
| Filter Type | Choose whether your users can access the filter value via a dropdown or toggle element |
| Set the filter values | Choose which filter values your users will have available to them |
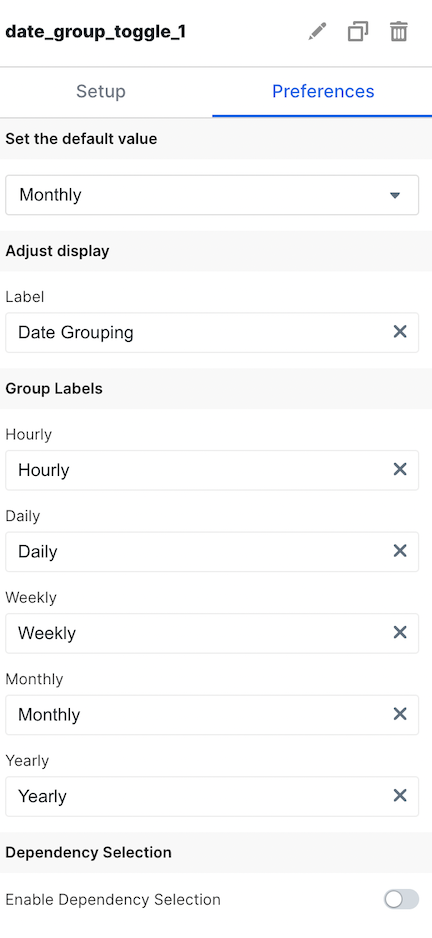
| Set the default value | Set the default selected value on dashboard load |
| Label | Set the label for the Time Dropdown your users will see |
| Group Labels | Change the labels of the dropdown options that your users see |
| Enable Dependency Selection | When enabled, you may create a dependency between this element and other elements on the dashboard. When this element is dependent on an element selected, it will be disabled until a value is selected by the user. |